


KLCI waves
KLCI waves 42 - Two Possible KLCI Waves Outcome and 2 BEST Glove Waves (HARTA & TOPGLOVE)

hotstock1975
Publish date: Sun, 24 Jan 2021, 10:32 AM
hotstock1975
0 101
Elliot wave analysis to measure price behavior for projecting next price actions
Weekly Time Frame
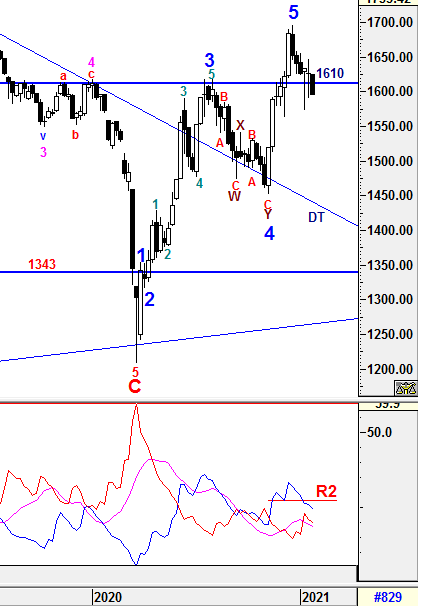
To recap, further consolidation phase may take longer than expected before a clear signal to either direction and 1610/1633.19 were still the levels to watch on Friday. Due to weakness of momentum, 1610 was unable to hold after it had been tested for the 3rd times. Therefore, downward pressure would continue in coming days to test and breach the immediate support level of 1590-1593. Once this level breached, we would see longer correction or consolidation phase to be emerged.
To reiterate, the Higher Degree of Correction waves are still being constrcuted after Wave 5 has been realized at 1695.87 instead of 1695.96. Subsequent minor waves would be elaborated further in daily time frame.
1) -DMI (red line) still heading down with narrow margin indicates bearish momentum is still decreasing with slower pace.
2) +DMI (blue line) still heading down with greater margin indicates bull strenght is decreasing with greater pace and it still hovering below R2 indicates caution mode is still required.
3) ADX (pink line) still heading down with consistent margin implying that the volatility of the current uptrend is still decreasing with consistent pace.
Therefore, the summations of the 3 signals above is still implying uncertainty is still emerging with consistent margin and caution is still required for any unexpected knee jerk reaction. From current situaton, Even +DMI is still above -DMI indicates bull strenght is still in favor with lower volatility, +DMI must curve up with continuous increased in ADX reading to justify a prominent uptrend to be developed.
Prevailing trend could be emerged if Weekly levels listed below was broken:
Resistance - 1700, 1720
Immediate Resistance - 1610, 1621-1624, 1635, 1642, 1650
Immediate Support - 1590-1593, 1577
Support - 1564, 1556,1530, 1490, 1438 (DT line)
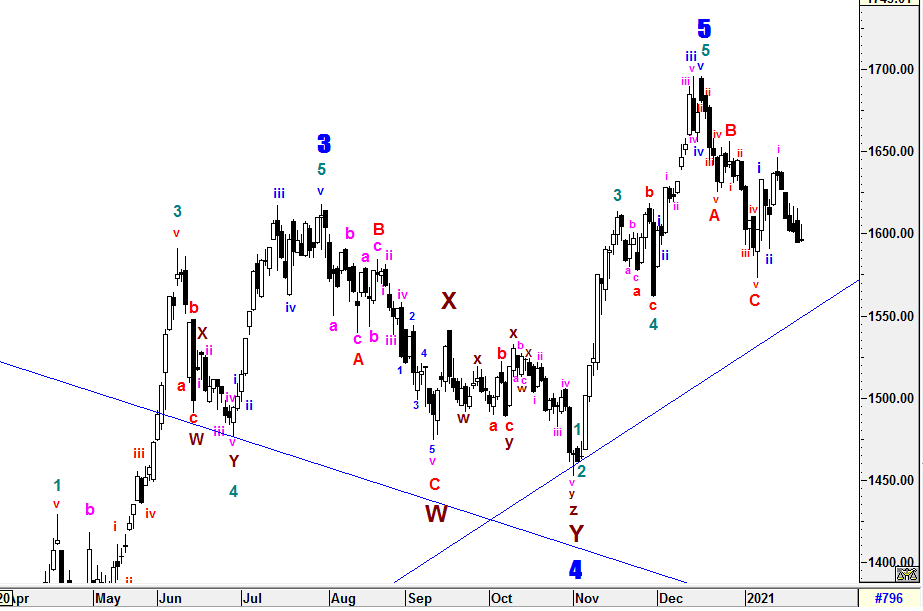
Daily Time Frame
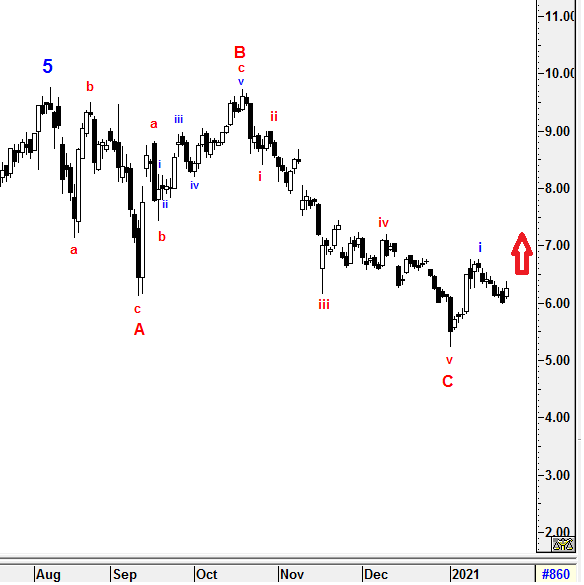
To recap, i assumed that i th sub minuette of iii rd sub minuette extension wave was being constructed as labelled currently as long as the low of ii nd sub minuette wave (1590.71) hold the ground. Otherwise, the prior low of Wave C (1572.62) could be threatening. No doubt that the high of Wave B (1655.96) is still the level to watch for validating the potential of Wave 1 construction.
In this case, i would elaborate on 2 possible outcomes of wave counts as below:
1) Below is the assumptions of a new set of Bull Run has started. ii th sub minuette of iii rd sub minuette extension wave could almost be realized from now as long as 1590.71 hold.
2) Below is the assumption of Bear Run continue to be emerged as WXY complex correction IF 1572.62 breached which would retify the prior uptrust as Dead Cat Bounce. Therefore, the prior minuette waves after Wave C would be revised as a-b-c (X) and new set of correction waves would be emerged to form a prolong Wave Y at lower level. If this is true, we will see an Head and Shoulder Formation which enable us to project the end of Wave Y approximately together with the waves analysis target projections. Target projections will be carried out if Bearish assumption realized.
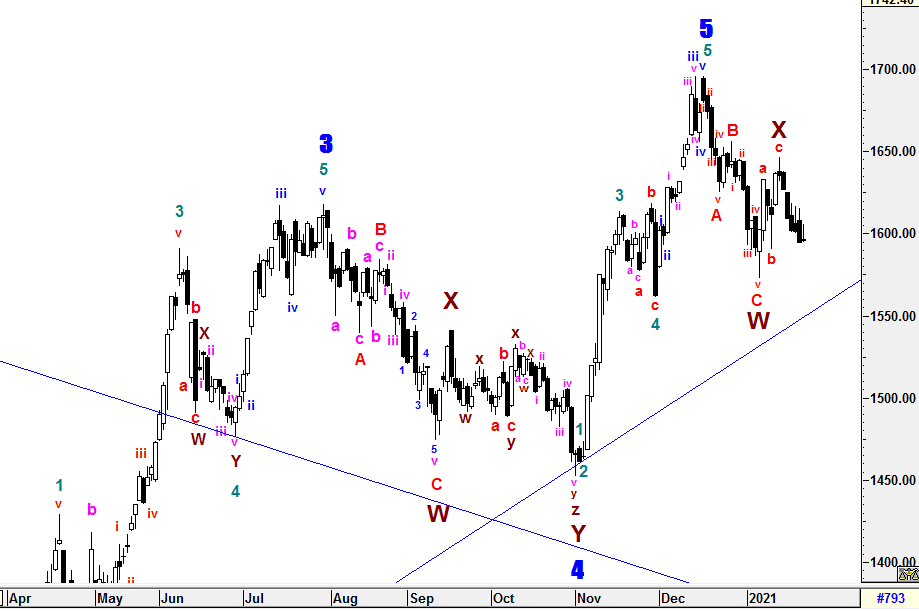
The entire wave structures will still be monitored closely if ii nd sub minuette wave (1590.71) or the low of Wave C at 1572.62 is breached as more complexity wave formations could be emerged such as multiple WXY correction waves may take place before new set of Higher Degree of 5 Waves Bull Run.
All waves' count and projected target are generated based on past/current price level and it may be subjected to vary if degree of momentum movement change.
Prevailing trend could be emerged if Daily levels listed below was broken:
Resistance - 1650, 1662, 1679, 1685, 1700, 1720
Immediate resistance - 1610, 1615, 1620, 1639-1631
Immediate Support - 1590, 1580, 1572, 1560, 1554-1551
Support - 1538-1545, 1530, 1490
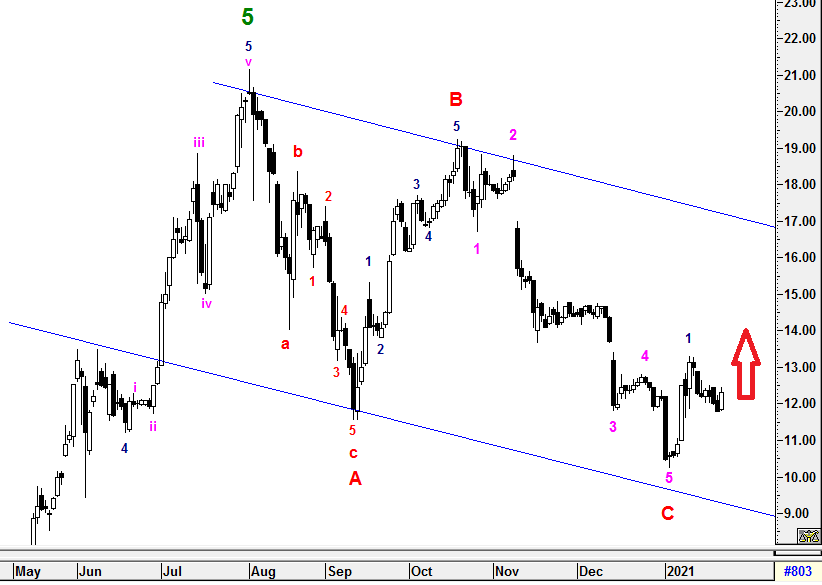
HARTA & TOPGLOVE Waves
--------------------------------
To recap from prior 2 sessions, i have briefly mentioned that most of the Glove stock might have completed the Higher Degree of ABC correction and 2nd sub minuette waves might have ended now unless sub extension bear waves emerged. Therefore, i have selected HARTA and TOPGLOVE which had constrcuted the BEST wave counts among these industry and both have rebounded from 50% FIBO retracement level of 1st sub minuette waves.
The entire wave structures will still be monitored closely and revised if the low of Wave C is breached which may indicate new sub minuette extension waves within Wave C could emerged.
HARTA
=====
TOPGLOVE
=======
================================
Patient is required for the SUPER CYCLE Bull Run
================================
Let's Mr Market pave the waves
Trade safely
Wave Believer
More articles on KLCI waves
KLCI waves 94 - WILL THE DOWNWARD PRESSURE TO BE IMPULSIVE TOWARDS WAVE E?
Created by hotstock1975 | Jan 24, 2022
KLCI waves 93 - EXTENSION UPWARD ENDED AND IT'S TIME TO THE DOWNSIDE?
Created by hotstock1975 | Jan 17, 2022
KLCI waves 89 - KLCI WILL EXTEND AND HIT LOWER TARGETS GRADUALLY
Created by hotstock1975 | Dec 20, 2021
Featured Posts


Latest Videos


.png)
Apps


Top Articles
1
The Alpha Trader
3
南洋行家论股
6
Bimb Research Highlights
7
BFM Podcast
8
BFM Podcast
#
Stock
Score
Daily Stocks
Stock Name
Last
Change
Volume
Stock Name
Last
Change
Volume
Stock Name
Last
Change
Volume
MQ Trading Signals
Stock
Time
Signal
Duration
Stock
Time
Signal
Duration
Featured Advertisers / Partners


Ride The Bull Short The Bear
CS Tan
4.9 / 5.0
This book is the result of the author's many years of experience and observation throughout his 26 years in the stockbroking industry. It was written for general public to learn to invest based on facts and not on fantasies or hearsay....