Weekly Time Frame
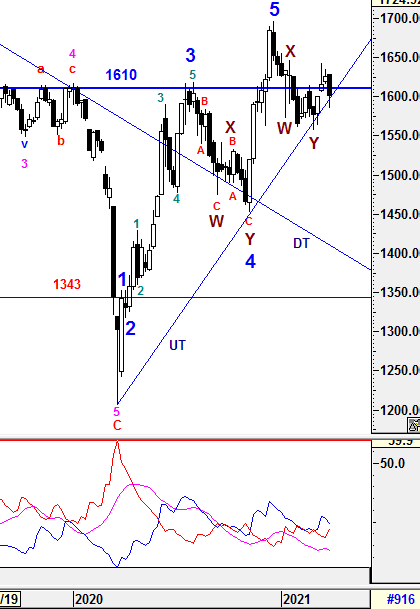
To recap from prior session 50, KLCI had traded above 1610 and closed at 1626.19. I was expecting KLCI would hover in an tight range before it may move higher. The gap support of 1600-1607 would act as critical support level to watch for justifying the current uptrend could be sustained in short run. On the other hand, the upside momentum would continue if the resistance of 1633 penetraded.
For the past 1 week, the gap support 1600-1607 was tested and closed within the gap at 1601.42 which was still beneath 1610. We need to see continuous better closing above 1610 to justify the uptrend is sustainable. Besides that, i will keep a closer watch on the UT line which could provide a support for sustaining the current uptrend and we might see more consolidation phase if UT line breached.
From wave count perspective, the Higher Degree of Correction wave would be prolong with Multiple WXY complex waves before a new set of Higher Degree of Bull Wave take place . Subsequent minor waves would be elaborated further in daily time frame.
1) -DMI (red line) curved up with greater margin indicates bearish momentum is still increasing with greater pace.
2) +DMI (blue line) continue to curve down with greater margin indicates bull strenght is decreasing with greater pace.
3) ADX (pink line) curved down implying that the volatility of the current trend is decreasing and still low.
Therefore, the summations of the 3 signals above is still implying Bull strength is still yet to be firm and caution is still required for any unexpected knee jerk reaction. From current situaton, +DMI is still above -DMI lines with lower spread indicating the current bull strength could take a halt and consolidating before regaining the momentum in coming weeks. The current volatility is still low and continuous increased in ADX reading would justify a prominent uptrend to be developed.
Prevailing trend could be emerged if Weekly levels listed below was broken:
Resistance - 1642, 1650, 1700, 1720
Immediate Resistance - 1607-1610, 1615, 1619, 1627, 1633
Immediate Support - 1600-1607, 1590-1593, 1580
Support - 1575-1577, 1564, 1556, 1530
Daily Time Frame
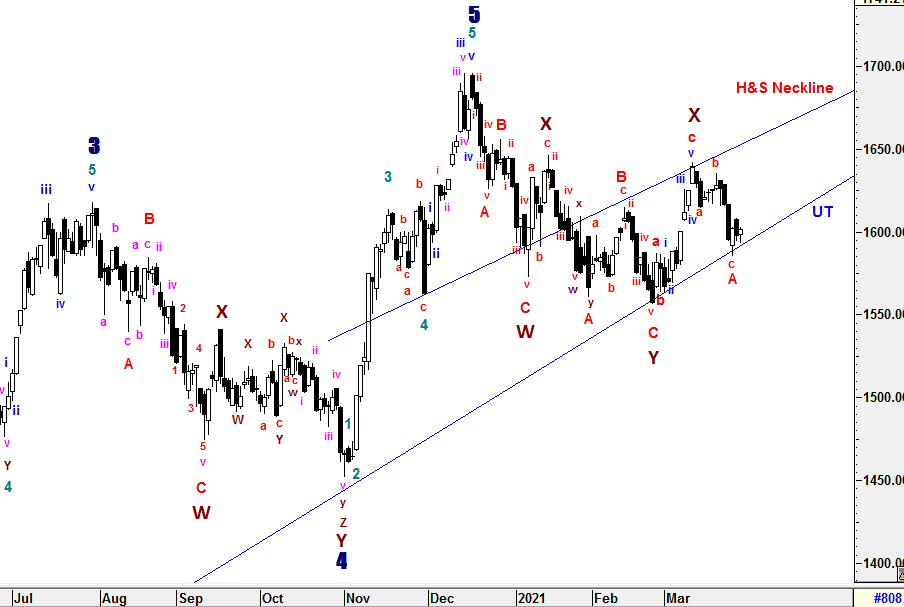
To recap from session 50, wave 4 could be constructing with abc formation and sub minuette wave c could be underway to the 2 FIBO level 1612 (FIBO 38.2 %) and 1603 (FIBO 50 %). If the current uptrend could be sustained, i was watching whether the up trend channel formed in between H&S neckline and new UT line could provide an foothold for further up side move.
Currently, wave c had ended at 1585.44 (FIBO 161.8%) which exceeded the minumum criteria mentioned above. The continouos selling momentum emerged after the gap support 1600-1607 was breached and led wave c to end below prior sub minuette wave 1. Due to the momentum changes, the wave counts have been revised from prior sub minuette wave 1-3 as an corrective waves as (a)-(b)-i-ii-iii-iv-v (c) in conjuntion to new Wave X2 (1642.2). Therefore, it has indicated there would be impending new Complex Waves to be formed. Besides that, the most recent abc corrective wave would be quote as wave A and wave B would have been underway to the upside before wave C. However, the Complex Waves structure formation may consist of various form and would be monitored closely.
Since Multiple Complex Wave emerged, the new set of Higher Degree of 5 Waves Bull Run or Primary Wave 3 have yet to be seen until all corrective waves are served convicingly. Thus, Higher Degree of Correction is still being prolong by these Multiple Complex Waves. The new UT line is still the support reference to watch which would influence the wave structure formation.
The entire wave structures will still be monitored closely if the high of Wave X1 (1646.24) is penetraded which indicates Higher Degree of implusive Wave 1 could have emerged. Thereafter, a new set of Higher Degree of 5 Waves Bull Run may take place and Primary Wave 3 would be emerged. On the hand, the prior Higher Degree of Correction would be prolong if Wave Y (1557.55) breached.
All waves' count and projected target are generated based on past/current price level and it may be subjected to vary if degree of momentum movement change.
Prevailing trend could be emerged if Daily levels listed below was broken:
Resistance - 1650, 1662, 1679, 1685, 1700, 1720
Immediate resistance - 1608, 1615, 1620, 1625-1628, 1639, 1645
Immediate Support - 1600, 1595, 1588, 1581-1585
Support - 1572, 1566, 1554-1551, 1538-1545
==================================================================================
Patient is required for the SUPER CYCLE Bull Run.
==================================================================================
Let's Mr Market pave the waves.
Trade safely
Wave Believer