


KLCI waves
KLCI waves 56 - DIAMOND FORMATION To RULE With KLCI Wave Z ?

hotstock1975
Publish date: Sun, 02 May 2021, 10:36 AM
hotstock1975
0 101
Elliot wave analysis to measure price behavior for projecting next price actions
Monthly Time Frame
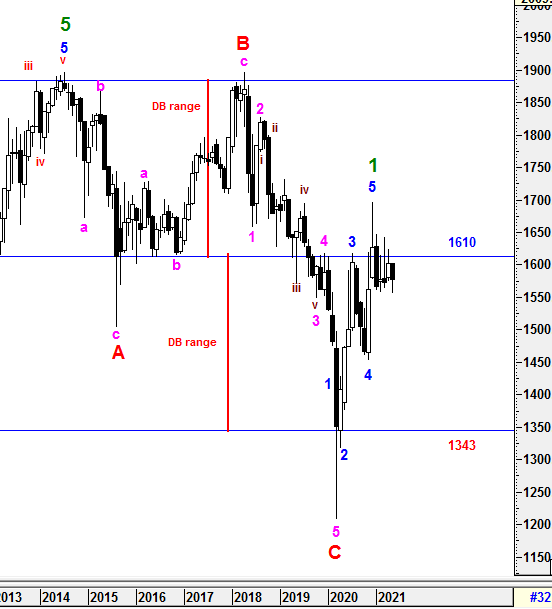
To recap from session 47, KLCI had made an false breakout above and retraced below 1610 based on Dec 2020 and Jan 2021 closing. Thus, an Bearish Engulfing Formation had been structured and yet to be realized unless KLCI break and close below 1566.4 on the coming March month end.
For the past 3 months, KLCI had able to close above 1566.4 without validation of Bearish Engulfing Formation and consolidated within the range of black candle of the Engulfing Formation (1566.4 - 1629). These has indicated that there could be an pending implusive waves to the upside in order to fail the Bearish Engulfing Formation. However, it still failed to close above 1610 to regain the momentum to the upside and overwrite the Double Formation (DB range) for long run. Nevertheless, i will still prefer KLCI would sustain good closing above 1610 in next few months in order to setup stronger foothold to the upside in longer run.
On wave counts perspective, Primary Wave 1 could be formed after 5 Higher Degree of Impulsive Waves had been structured from March to Dec 2020. No doubt that Primary Wave 2 correction is still underway which expected to be a prolong waves unless a unknown catalyst emerged to re-write the extension waves within. Therefore, smaller time frame would be monitor closely for any unexpected waves incurred. Subsequent minor waves would be elaborated further in daily time frame.
To reiterate, the Double Formation (DB range) structure formed in between July 2014 and April 2018 could be overwritten by Primary Wave 3 Bull Run when Primary Wave 2 correction end.
The new Super Cycle Bull Wave is still valid and expecting some knee jerk reactions along the prolong cycle.
Prevailing trend could be emerged if Monthly levels listed below was broken:
Resistance : 1610
Support : 1560, 1525-1530, 1500, 1465
Weekly Time Frame
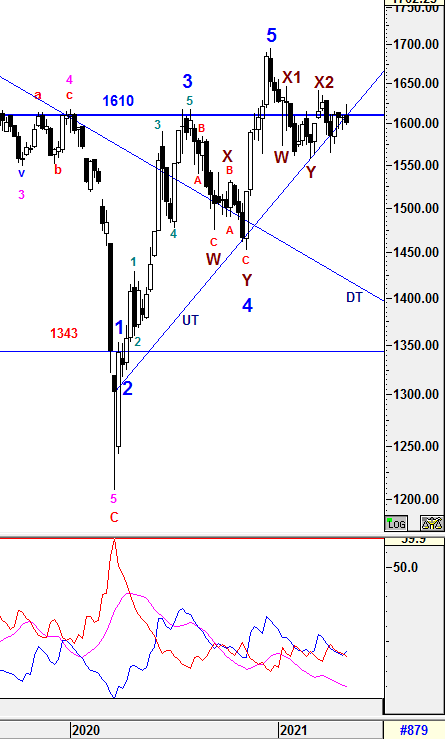
To recap from prior session 55, KLCI had been consolidating and closed above 1598.57 which indicated upside bias emerged and could validate Bullish Engulfing setup if KLCI able to close above 1612.25 on next Friday. However, i was still considering 1610 is the critical level to watch for longer run.
For the past 1 week, KLCI had retested towards higher level but resisted at 1627 and retraced back to consolidation area. By closing above 1598.57, Bullish Engulfing setup is still can be validated if KLCI to close above 1612.25 convincingly. However, i will be very caution since KLCI is still yet to move and close above 1610 convincingly unless we can see more formidable closing in next few weeks.
From wave count perspective, the Higher Degree of Correction wave would be prolong with Multiple WXYXZ complex waves before a new set of Higher Degree of Bull Wave take place. Subsequent minor waves would be elaborated further in daily time frame.
1) -DMI (red line) continue heading down with higher margin indicates bearish momentum is decreasing with higher pace.
2) +DMI (blue line) curved up with reasonable margin indicates bull strenght is increasing with reasonable pace.
3) ADX (pink line) continue heading down implying that the volatility of the current trend is decreasing and still very low.
Therefore, the summations of the 3 signals above is still implying Bear strength is in favor and caution is still required for any unexpected knee jerk reaction. From current situaton, +DMI is above -DMI lines with lower spread indicating the bull strength is in favor with minor momentum and consolidating will continue before regaining the momentum in coming weeks. The current volatility is still low and continuous increased in ADX reading would justify a prominent uptrend to be developed.
Prevailing trend could be emerged if Weekly levels listed below was broken:
Resistance - 1633, 1642, 1650, 1700, 1720
Immediate Resistance - 1610, 1615, 1619 , 1627
Immediate Support - 1600, 1580, 1575-1577
Support - 1564, 1556, 1530
Daily Time Frame
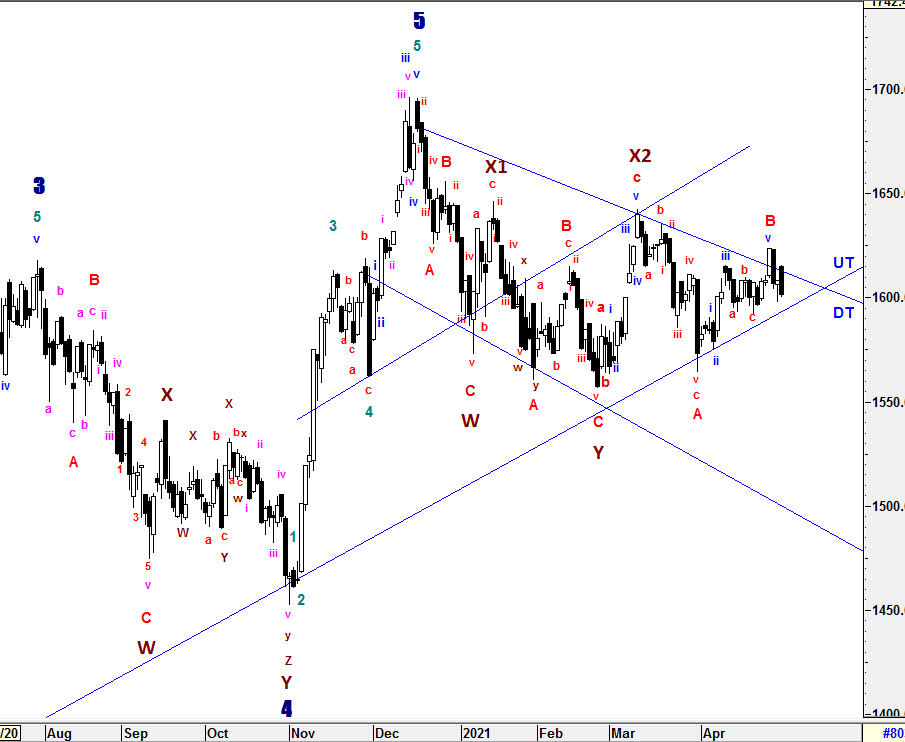
To recap from session 55, KLCI had been consolidating in a tight range in between DT and UT lines. Assuming wave B construction consist of 5 waves structure, sub minuette wave i-ii-iii-a-b-c had been formed with a possibility wave iv could have ended at 1591.83. If this is true, sub minuette wave v could have started and might end at higher level. However, these minuette corrective waves would still be monitored closely for anticipating any impending complex waves next weeks. Therefore, both levels 1590.67 and 1615.49 were still the levels to watch to justify the criteria as mentioned in prior session above.
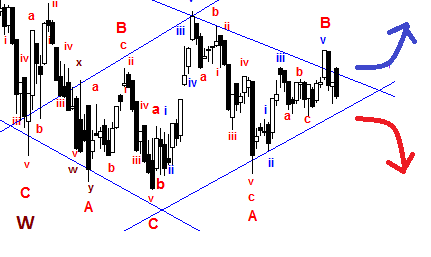
Currently, sub minuette wave v could have ended at 1623.47 in conjunction with realizing wave B. Due to momentum changes, there was an false breakout incurred at DT line indicated weakness emerged in coming days. Next, we could see wave C construction starting from now to the downsides which could lead to a possible target in between 1575 (FIBO 61.8%) to 1545 (FIBO 100%). On the other hand, there was an Diamond Formation (As labelled below) which provides 2 possible theoretical targets if breaokout event emerged in either direction. If the breakout incur to the upsides, the upside target will be around 1700. Otherwise, the downside target will be around 1500 which is matched with one of the extension waves target 1500 (161.8%). Therefore, i won't rule out that any possibility may come if extension waves emerged along the way. As for now, we are very close to the edge of UT and DT lines which provides more clearer and formidable direction after the breakout event in next few days.
To reiterate, Wave Z could be formed in various correctives wave structure (Zig-Zag, Flat, Diagonal and etc) with momentum changes along DT and UT lines.
Since Multiple Complex Wave emerged, the new set of Higher Degree of 5 Waves Bull Run or Primary Wave 3 have yet to be seen until all corrective waves are served convicingly. Thus, Higher Degree of Correction is still being prolong by these Multiple Complex Waves WXYXZ.
The entire wave structures will still be monitored closely if the high of Wave X1 (1646.24) is penetraded which indicates Higher Degree of implusive Wave 1 could have emerged. Thereafter, a new set of Higher Degree of 5 Waves Bull Run may take place and Primary Wave 3 would be emerged. On the hand, the prior Higher Degree of Correction would be prolong if Wave Y (1557.55) breached.
All waves' count and projected target are generated based on past/current price level and it may be subjected to vary if degree of momentum movement change.
Prevailing trend could be emerged if Daily levels listed below was broken:
Resistance - 1645, 1650, 1662, 1679, 1685, 1700, 1720
Immediate resistance - 1608-1610, 1615, 1620, 1625-1628, 1639
Immediate Support - 1600, 1595-1597, 1585, 1580, 1572
Support - 1566, 1554-1551, 1538-1545
Patient is required for the SUPER CYCLE Bull Run.
==================================================================================
Let's Mr Market pave the waves.
Trade safely
Wave Believer
More articles on KLCI waves
KLCI waves 94 - WILL THE DOWNWARD PRESSURE TO BE IMPULSIVE TOWARDS WAVE E?
Created by hotstock1975 | Jan 24, 2022
KLCI waves 93 - EXTENSION UPWARD ENDED AND IT'S TIME TO THE DOWNSIDE?
Created by hotstock1975 | Jan 17, 2022
KLCI waves 89 - KLCI WILL EXTEND AND HIT LOWER TARGETS GRADUALLY
Created by hotstock1975 | Dec 20, 2021
Discussions
Be the first to like this. Showing 6 of 6 comments
Post a Comment
Featured Posts
Introducing MY's First IPO Fund for Sophisticated Investors!
New Update. Discover investment communities that resonate with your ideas
M & A Value Partners IPO Equity Fund has been launched - Targeted 13% Return p.a
Latest Videos


Apps


Top Articles
1
The Alpha Trader
3
Rakuten Trade Research Reports
4
南洋行家论股
7
TA Sector Research
8
BFM Podcast
#
Stock
Score
Daily Stocks
Stock Name
Last
Change
Volume
Stock Name
Last
Change
Volume
Stock Name
Last
Change
Volume
MQ Trading Signals
Stock
Time
Signal
Duration
Stock
Time
Signal
Duration
Featured Advertisers / Partners


Ride The Bull Short The Bear
CS Tan
4.9 / 5.0
This book is the result of the author's many years of experience and observation throughout his 26 years in the stockbroking industry. It was written for general public to learn to invest based on facts and not on fantasies or hearsay....
hotstock1975
KLCI has breached down from DIAMOND FORMATION since Monday and entering into the Waves criteria of FIBO region (61.8 - 100 %). Let's see whether KLCI would make a reversal from DIAMOND FORMATION target or Wave's FIBO target?
2021-05-06 10:20