


KLSE Stocks Review
KNM (7164) The Story behind the Chart of KNM GROUP BHD

ChartStory72
Publish date: Mon, 13 Sep 2021, 01:19 PM
ChartStory72
0 211
We post FREE chart reviews on KLSE daily Top Gainers and Most Actively Traded Counters. We are also giving out free reviews for our subs as well. Come join us on Telegram and PM us to learn more and request for the stocks you need reviewing for FREE.
Facebook : https://www.facebook.com/thechartstory
Telegram : https://t.me/thechartstory
Facebook : https://www.facebook.com/thechartstory
Telegram : https://t.me/thechartstory
KNM 7164
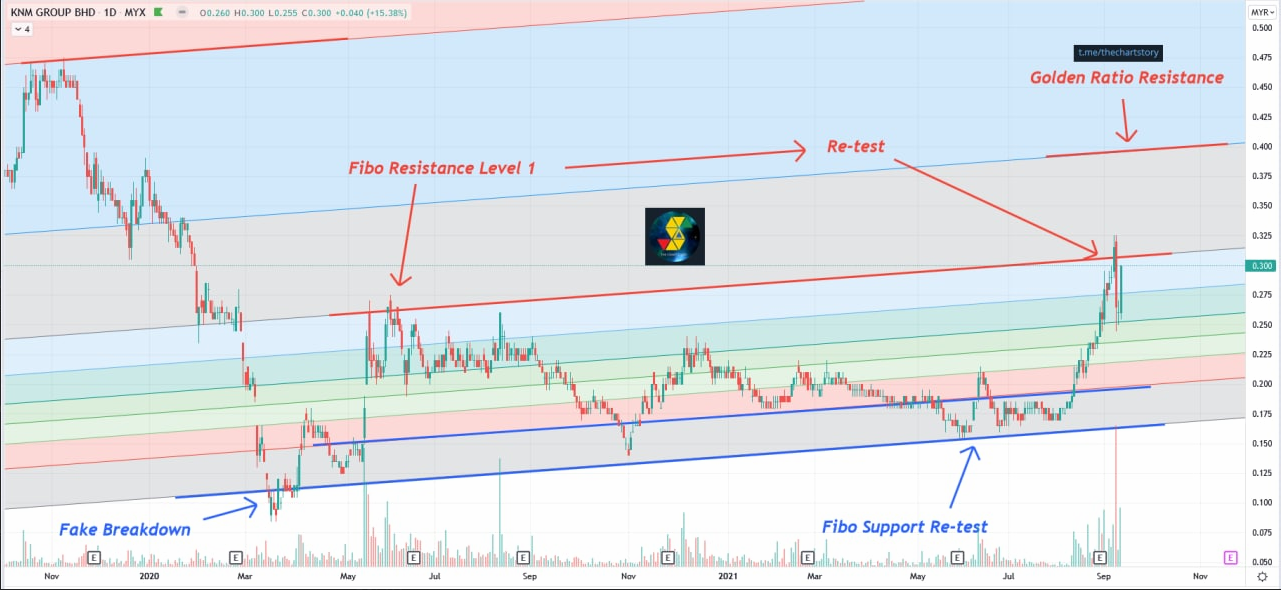
Overall prices may still seem to be in a ranging mode, however, the hints that prices are giving out may say otherwise. One of the most obvious hints given by the price is that higher lows are forming and this indicates that the buyers are slowly coming back, forming a ranging uptrend which is Hidden in Plain Sight.
Fast forward last week, we can see that prices are now re-testing the Fibonacci Resistance Level 1 as it had been tested once previously and could not breakup from it. This indicates strength as well, as the bankers are using the that resistance level for now.
Good news is that, if prices are able to breakup from the Fibonacci Resistance Level 1, then a new uptrend will begin and the next resistance level would be the Golden Ratio Resistance Level. However, if prices are unable to break up then the range will continue until the bankers have collected enough shares.
Industry: Energy Resources.
Come join us on Telegram and PM us to learn more and request for the stocks you need reviewing for FREE. We also post other extra contents that we do not share here, which includes weekly recap and weekly analysis.
Telegram : https://t.me/thechartstory
In this fast-moving digital world, we get information in a few clicks.
However, we rarely get first-hand information and more often we get misleading news.
Investing in stocks today is very different from the past, but one thing hasn't changed - to study about a stock before putting money in.
A stock chart contains data that is publicly available and accurate by itself. By having certainty in data quality, we can comfortably study charts and make investment judgements.
At Chart Story, we believe stock prices move for a reason. Our objective is to share what we believe.
Related Stocks
| Chart | Stock Name | Last | Change | Volume |
|---|
More articles on KLSE Stocks Review
YTL (0025) The Story behind the Chart of YTL CORPORATION BERHAD
Created by ChartStory72 | May 05, 2022
DSONIC (5216) The Story behind the Chart of DATASONIC GROUP BERHAD
Created by ChartStory72 | Apr 18, 2022
FRONTKN (0128) The Story behind the Chart of FRONTKEN CORP BHD
Created by ChartStory72 | Jan 18, 2022
ANNJOO (6556) The Story behind the Chart of ANN JOO RESOURCES BHD
Created by ChartStory72 | Jan 17, 2022
EVERGRN (5101) The Story behind the Chart of EVERGREEN FIBREBOARD BERHAD
Created by ChartStory72 | Jan 11, 2022
TEXCYCL (0089) The Story behind the Chart of TEX CYCLE TECHNOLOGY (M) BERHAD
Created by ChartStory72 | Jan 10, 2022
Wong (7050) The Story behind the Chart of WONG ENGINEERING CORPORATION BERHAD
Created by ChartStory72 | Jan 03, 2022
TOPGLOV ( 7113) The Story behind the Chart of TOP GLOVE CORP BHD
Created by ChartStory72 | Dec 06, 2021
Discussions
Be the first to like this. Showing 2 of 2 comments
Silly analysis. Higher lows doesn't mean much if you consider other risk factors. Fair value is probably 0.18 - 0.23
2021-09-14 06:28
Post a Comment
Featured Posts
Introducing MY's First IPO Fund for Sophisticated Investors!
New Update. Discover investment communities that resonate with your ideas
M & A Value Partners IPO Equity Fund has been launched - Targeted 13% Return p.a
Latest Videos


MQ Trading Signals
Time
Signal
Duration
Type
2024-07-24 16:25:00
EMA 5
5 Mins
BUY
2024-07-24 16:25:00
ADX
5 Mins
BUY
2024-07-24 16:25:00
OBV
5 Mins
BUY
2024-07-24 16:20:00
VOLUME BREAKOUT
10 Mins
BUY
2024-07-24 16:20:00
EMA 5
5 Mins
SELL
Apps


Top Articles
1
BFM Podcast
3
CGS-CIMB Research
Genting Plantations - Proposed Land Acquisition in Indonesia
4
5
Koon Yew Yin's Blog
7
Koon Yew Yin's Blog
8
南洋 - 凭单专栏/温世麟
#
Stock
Score
Daily Stocks
Stock Name
Last
Change
Volume
Stock Name
Last
Change
Volume
Stock Name
Last
Change
Volume
Featured Advertisers / Partners


Ride The Bull Short The Bear
CS Tan
4.9 / 5.0
This book is the result of the author's many years of experience and observation throughout his 26 years in the stockbroking industry. It was written for general public to learn to invest based on facts and not on fantasies or hearsay....
annmix
Just another useless con counter. Avoid
2021-09-13 15:29