


Choivo Capital
(CHOIVO CAPITAL) Really Understanding Owners Earnings

Choivo Capital
Publish date: Mon, 27 Jan 2020, 03:29 PM
For a copy with better formatting, go here, its alot easier on the eyes.
Really Understanding Owners Earnings
========================================================================
One of the things I’ve been really thinking about for the last few weeks “Owners Earnings”, the valuation method detailed by Warren Buffet in Berkshire Hathaways 1986 annual report.
In that report, Warren Buffet stated that the value of a company is simply the total of the net cash flows (owner earnings) expected to occur over the life of the business, minus any reinvestment of earnings.
It was defined by him as such,
“These represent (a) reported earnings plus (b) depreciation, depletion, amortization, and certain other non-cash charges, less (c) the average annual amount of capitalized expenditures for plant and equipment, etc. that the business requires to fully maintain its long-term competitive position and its unit volume.
Our owner-earnings equation does not yield the deceptively precise figures provided by GAAP, since (c) must be a guess – and one sometimes very difficult to make. Despite this problem, we consider the owner earnings figure, not the GAAP figure, to be the relevant item for valuation purposes.
All of this points up the absurdity of the ‘cash flow’ numbers that are often set forth in Wall Street reports. These numbers routinely include (a) plus (b) – but do not subtract (c).”
In essence, it means,
Owners Earnings =
(a) Reported Earnings
Add: (b) Depreciation and Amortization
Add/Less: (c) Other Non Cash Items
Less: (d) Average Annual Maintenance Capex
Add/Less: (e) Changes in Working Capital
I’ve been using this in my analysis quite a bit, and to be honest, it can be a bit of a drag digging out the non-cash items to put into the my excel sheets, some of it strike me as activity that adds very little value.
And therefore, I’ve been thinking about how to simplify it a little, without affecting the essence of why this tool is used.
Having used this for about 20 companies, with the analysis of each company usually spanning 10 years at minimum, I’ve come to the conclusion, that for me, the main use of this tool, is to determine,
- The level of efficiency achieved by the management, based on the amount of net working capital require to run the business.
- The ability of the management to reinvest earnings at high rates of return. (or the lack of ability to be honest).
Therefore, for my own analysis, I’ve made some amendments to focus more on the above, and they are as follows.
(Do note, that for me writing is often the process by which i realize i know nothing about what I’ve talking about, and a way of finding more clarity for me.
The main reason I am writing this article is to properly condense my thinking on Owners Earnings, everything else is just gravy. So things may seem a little incoherent at times)
Reported Earnings.
I use “Total Comprehensive Income” for “Reported Earnings”.
Why is this the case? Why not “Profit After Tax” instead? This is because there are many items, that have a real bearing on long term profitability, but is not usually seen in your profit after tax. These consist of items such as, Foreign Currency Translation, Hedging Fair Value Changes/Cost, Pension Fair Value Changes, Fair Value Changes in Investments etc.
Now, if you were to be doing one when you only have data for say 2-3 years, it would potentially make sense to use “Profit After Tax” as the numbers are less volatile and more meaningful.
But if like me, you are using data available as early as 2 years before the IPO, which can often run more than 10-20 years. All these fair value changes when seen over a long period of time, can be quite meaningful, in identifying management’s ability to do hedging, if they are investing in things (in countries) they know little about (foreign currency translation), if they are under-accruing pensions etc.
In addition, these fair value changes etc constitute real profits or losses. Just because they are unrealized this year, does not mean they won’t be realized the next year. And if they are realized, due to the company already taking up these fair value changes in the previous year, the realized losses/profits will not show up in the current year profit/loss (other than the net difference, which is usually much smaller).
Having said that, they are exceptions to the rule.
Berkshire Hathaway are now require to report the fair value changes to their investment holdings (based on the prevailing market price) under their P/L, which can severely change the profit/loss numbers of the company, especially since it only started 2 years ago.
Given that their holdings are usually very long term, it would make more sense to ignore the changes in fair value of investments, but instead create mini financial statements for each holding, and identify the earnings attributable to Berkshire from these holdings.
Having said that, if you knew the fair value changes of Berkshire’s Investment Holdings since inception, and can line them up, it would make sense to consider the changes in fair value of investments to be meaningful (and very much so).
Depreciation and Amortization
Not much comments here (surprise, surprise), a fairly straightforward item, except I usually lump in any loss/gain on disposals, or loss/gain on fair value changes relating to Investment Properties etc.
I look at this in terms of more than just the property plant and equipment, but also in terms of investments in subsidiaries, associates, joint ventures, and shares etc.
My purpose for doing this, is so that, I will be able to see on the net basis, what is the outflow that goes towards new investments, whether in PPE’s or another stakes company, and the results of these, on the owners earnings of the companies, net of capital expenditures.
Other Non Cash Items.
This one is quite interesting. This category, includes items, such as unrealized foreign currency gains/losses, provisions for doubtful debts, other provisions etc
Initially, I used to split them out in a separate line (except for unrealized forex), however, I found it to be a relatively low value activity in that, it rarely gave me new insight into the company. Other than a few scenarios, particularly in Genting’s and RGB’s audited accounts. Where for some years the provision for doubtful debts is very significant, as well the subsequent write backs.
Being able to see it in sequence gave me an idea of the challenges the companies went through, how much of it still applies today.
Having said that, these items usually net off over the long term, if one has the time, you may consider listing them out, if not, you’re not missing out as much.
In addition, as i take comprehensive income, which includes taxes, you do not need to bother about over / under provision of taxes, as if looked over the 10 year timescale, it should be balanced off.
The key item here to consider in this category is this.
Many companies have associates or joint ventures, whose profit is recorded using the equity accounting method. In layman terms, the companies’ proportion of those associates/JV’s profit, is recorded directly in the company’s P/L.
For me, I consider the earnings of these companies just as valuable regardless if dividends were paid out, however, for others they are considered a “non-cash” item and therefore removed and replaced with dividends received from those companies.
I don’t do this, it may be a good idea, or not.
In addition, as I used “Total Comprehensive Income” as a starting point, without considering if its attributable to shareholders or non-controlling interest (minority shareholders in fully consolidated subsidiaries), I will deduct out dividends paid to unconsolidated subsidiaries when deriving owners earnings.
Average Annual Maintenance Capex
For this, I use the “Total Capital Expenditure & Acquisitions of Companies”. This is mainly because that any average annual maintenance capex calculated will likely be very arbitrary.
The key point here is
“average annual amount of capitalized expenditures for plant and equipment, etc. that the business requires to fully maintain its long-term competitive position and its unit volume.”
If someone automates their factory, it is considered an effort to maintain competitive position, so does any new usage of technology etc
Very rarely does any new capital expenditure qualify, unless it increases unit volume, and even if it does it is not so clear cut.
For example, PCHEM’s Rapid PIC, how much of the new capex is for the new unit volume, and how much of it is to replace/bolster existing unit volume? Quite a difficult question to answer, even if you’re working in PCHEM.
That is why, for me, I just use the total capital expenditures. (Do note i also consider advances/loans to associates and joint ventures to be a capital expenditure, repayments will be added back).
In exchange, in order to identify if the investments in each new investment result in higher earnings, I created a separate line, “Owners Earnings Ex Capital Expenditure”.
If these investments do give incremental returns, Owners Earnings Ex Capital Expenditure should show an upwards gain over time. Many companies are unable to show this consistently or show above average results.
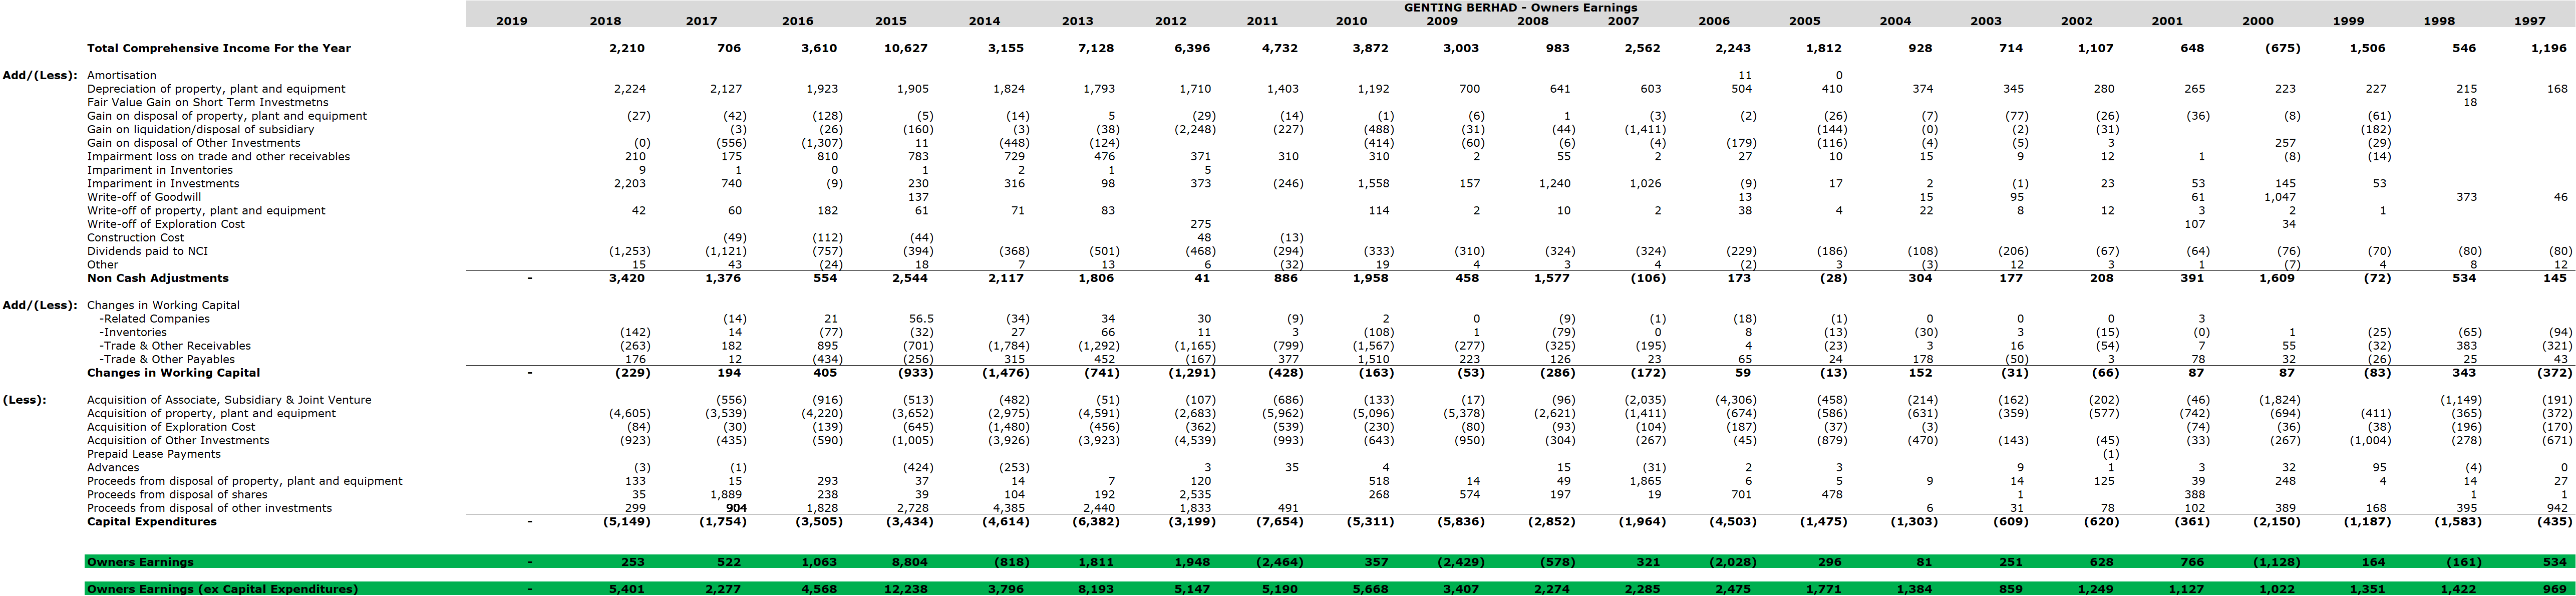
For example, GENTING invested roughly RM66 billion to capital expenditures and acquisitions from 1997 to 2018 (net of any disposals).
In return, its owners’ earnings have grown from RM1 bil to roughly RM5 bil (when averaged out over 5 years, I did so as its very volatile). That indicates a return of roughly 6% (RM4b/RM66b).
Now, if we assumed depreciation and other charges are equal to the average annual capital expenditure needed to maintain competitive position, this would indicate a return of roughly 8% (RM4b/RM50b), a slightly better figure.
It might almost had been better, if GENTING just took that excess cash since 1997 and put it into fixed deposits or paid them out as dividends. It would definitely had been better, if they just bought an Index Fund with the money.
Working Capital
As positive change indicates either or a combination of
- Decrease in inventories and trade receivables
- Increase in trade payables
And a negative, vice versa. If a management can reduce the working capital needed to run a business, or ensure that the increase in working capital requirements is slower than revenue or better yet profit growth. It is a pretty strong indicator of competence and efficiency.
The best management almost instantly reduces the working capital required in a business; this is particularly clear especially when a good management takes over from a bad one.
One thing here you can really see, if the working capital in relation to associates, joint ventures etc. Which if its consistently negative, is a pretty big red flag for me, as it can indicate bad governance issues, where a company is basically funding the other party, where the majority owner, may be the main shareholder there as well.
Which basically results in your funding his hobby business, quite common actually.
Conclusion
And that’s it folks.
Having said that, do note, that at the end of the day, the value of an investment is all future cashflows discounted back to present value.
Like all these other ratios/tools like PE, EV/EBITDA, EV/EBIT, ROE, ROA etc. They are all at its best a tool. And these tools are no substitute for understanding the company. But are at best supplemental.
Having said, I do think Owners Earnings are one of the better ones, and the process of filling it out for the 20 year history of a company, sure does give more insight. A natural consequence of spending significantly more time with the financial statements of the company. You will be surprised at the things you feel you would have missed out otherwise.
I’ve also included the “Owners Earnings” of the companies, mentioned in this article for your own reference.
As always, let me know if you disagree or feel I missed out on anything.
Happy Chinese New Year.
Disclaimers: Refer here.
====================================================================
Facebook: Choivo Capital
Website: www.choivocapital.com
Email: choivocapital@gmail.com
More articles on Choivo Capital
(CHOIVO CAPITAL) MYNEWS (5275) – Dr CU in da house. 66% Upside
Created by Choivo Capital | Dec 09, 2020
(CHOIVO CAPITAL) WCE (3565) – When the roads align. 562% Upside.
Created by Choivo Capital | Dec 05, 2020
(CHOIVO CAPITAL) BAT (4162) - Budget 2021 (The Dark Knight Rises)
Created by Choivo Capital | Nov 09, 2020
(CHOIVO CAPITAL) LIONIND (4235) - Budget 2021, Rising Steel Prices
Created by Choivo Capital | Nov 09, 2020
(CHOIVO CAPITAL) KRONO (0176) - Is it Alibaba (Alibaba Cloud)? (SUMMARY)
Created by Choivo Capital | Nov 03, 2020
Featured Posts


Latest Videos


Apps


Top Articles
1
Good Articles to Share
2
3
Mercury Securities Research
4
BFM Podcast
5
6
Koon Yew Yin's Blog
7
BFM Podcast
8
BFM Podcast
#
Stock
Score
Daily Stocks
Stock Name
Last
Change
Volume
Stock Name
Last
Change
Volume
Stock Name
Last
Change
Volume
MQ Trading Signals
Stock
Time
Signal
Duration
Stock
Time
Signal
Duration
Featured Advertisers / Partners


Ride The Bull Short The Bear
CS Tan
4.9 / 5.0
This book is the result of the author's many years of experience and observation throughout his 26 years in the stockbroking industry. It was written for general public to learn to invest based on facts and not on fantasies or hearsay....