


Rules of Investment
Reading The Body Language of Market (Part1)

SimonShuet
Publish date: Thu, 28 Jan 2016, 10:35 AM
SimonShuet
0 16
The Blog Depicts the Writers View of the Market as seen from his 20 years experience.
It is inspired to help investors and traders to have an alternative view in all our endeavour to be better market investors.
It is inspired to help investors and traders to have an alternative view in all our endeavour to be better market investors.
There are many ways of reading the market behaviour. Much like human body language, one gesture may mean a few things while another may mean something straight forward. A behaviour is made up of many gestures and this is where accurate intepretation is required. Reading many gestures to interpret a behaviour.
Example 1:
During a fantastic sales, people are frantically rushiing to grab whatever they could buy because it is cheap. From the outside this can be viewed as very cheap or meeting what the market wants or it could also be festive rush. Which ever it is, the gestures of the buyers are one of interest and excitment.
Example 2:
During a crisis like the one in Greece where there is a money shortage in the banks, and cash withdrawals are limited. Your view of the same people rushing to withdraw money is one which is frantic with urgency or anger and even disappointment.
In the interest of our current market enviroment, where investors and traders are trying to decide whether to leave or enter the market, this is what we want to be able to read so that we don't get the wrong interpretation of interest buying vs panic selling. In Part 1 we will cover
a) PE Ratio
b) Buy Rate - Leading to RSI
c) Volume by the hour
Note: There is no best day to enter in a bearish market that has already bottom out. You can guess that tomorrow will be better or worst day to enter or Friday is a better day to buy than any other day of the week. The only thing is to ensure the market doesnt crash. Market signal is coming from the US especially DJ. There are still safety net, to be precise 2 levels of safety net (support)
So if we cannot predict what is the outcome tomorrow of DJIA or Fed annoucnement or any other outcome, we are safer with information we already know. We know crude oil price is lower than previous quarter, we know exchange rate of MYR vs USD remains weak. The last Quarter results to be out next month (for majority counter) is based on December 2015. We know export counters especially those to US are beneficiary of the exchange rate however the coming result will be base on
Billed (Reflects Growth) + Unbilled (Moving forward Sustainence) + Extraordinary Gain (eg. Forex, High FD rate etc)
 Since for the last 2 Quarters Monetary Exchange Rate has provided the gain for export business, the Forex Gain should not be use as a yardstick but to use the Growth and Sustainence to measure. As such EPS may be the focus.
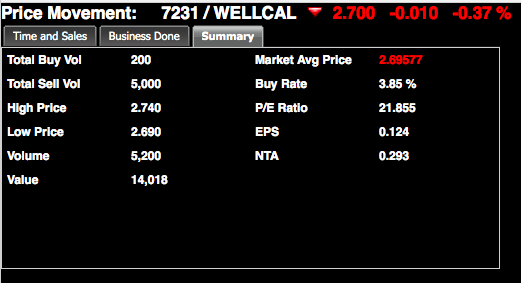
Most of us understand P/E ratio as a ratio acceptable and applicable by a number tied to a sector (eg Sector X - acceptable PE = 12 while Sector Y - acceptable PE = 10 etc) What if I told you today to think of PE ratio as a ROI period? The lower the RATIO means earlier ROI. Hence EPS may play a key role in the coming results. The higher the EPS will bring the price up to par. This will ensure a price movement in anticipation.
Coming back to the 2 examples I have shared on behaviour and gestures. Much of the focus in my opinion will be on the above criteria however to put it into the stock we are buying for the day, we would like to be able to tell if the market is in panic or in collection. Here I rely on Buy Rate vs Price Movement vs Volume.
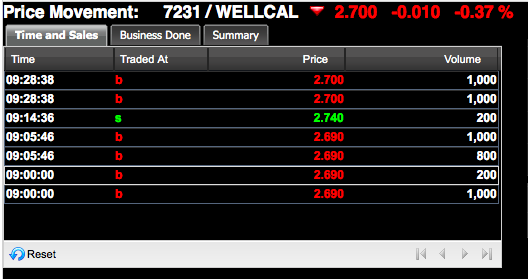
Refer to Snapshot B Pls note Buy Rate is NOT the statistic accumulated at Buy position (denoted by Traded At b in the snapshot below) In fact it is the opposite. Buy Rate is "Buyer buying at Seller's position". So in the snapshot below Buy Rate stats is base on Traded At s happening at 09:14:36. So if someone tells you panic selling happening at a counter, what they really mean is "Seller selling at Buyer position with VOLUME" denoted with more b and the buy rate reading will be LOW. Also note it is NOT panic selling if Buy Rate is LOW but volume is LOW. It is panic selling if Buy Rate is LOW and volume is HIGH.
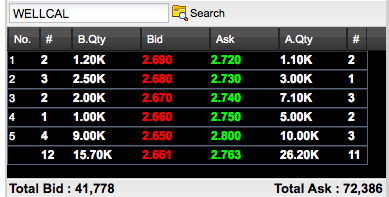
How do you see if a collection is in progress?
A collection is in progress when the buyer queues at buy position and wait for seller to relent. The longer the stalled period, the better because very likely the seller will relent in the current situation. If the seller relent, the Buy rate will reduce and you will see the buyer replenish his queue. Collectors seldom queue in large volume because they do not want it to become a support level and secondly it is easier to sell and replenish without exposing themselves.
If sellers are adamant not to sell down, the collector wil buy at seller position and clear it and then stop the buying until the seller replenish at that price or lower. When this happens we always see Buy rate HIGH but price does not move up.
The above is Traders' game. For investors, they look at RSI for summary. Its either Oversold (30 or <), Overbought (70 or >) or Neutral (Between 30 and 70) Investors may not see the game if volume is low
A)
B)
C)
In the final part, I will touch on volume. Volume is a key essential to breaking resistance. Resistance here refer to high sell volume. Without constant volume bombardment from buyer, the seller volume will consistenly build up. Any run up in price will breakdown when buying volume recedes. So volume is essential. In a bullish stock or a breakout, the formula is as follow
Buy Rate + Volume + Price Movement = Breakout or Breakdown
Consistent High Buy Rate + Consistent High Volume + Price Escalating = Breakout or Bullish
How do you measure Consistent Volume?
Refer to my earlier posting "How and When to Post Your Buy Queue in a Back and Forth KLCI enviroment" on the timing to post your buy queue, this is what i normally do for a PARTICULAR stock that i am interested in
- Take a volume snapshot from 9 -10am
- Second volume snapshot from 10am to 11am
- Third will be hourly (if you hv time) if not take the total volume divided by the hrs of trading.
This is basically my speedometer. If the volume drops drastically, I will likely queue my buy much lower.
Note: This method is only a personal practice that is used in a bearish market.
More articles on Rules of Investment
What are the odds of trading against the coming Quarter results?
Created by SimonShuet | Feb 08, 2016
How and When to Post Your Buy Queue in a Back and Forth KLCI enviroment
Created by SimonShuet | Jan 27, 2016
Discussions
1 person likes this. Showing 15 of 15 comments
Welcome. I believe the market always want recovery. It will try to recover at every instant as long as it does not crash. i would like to see strengthening at 1655 to complete the cycle of consolidating and moving
2016-01-29 09:44
Simon I just want to say how right you are. With the strengthening of RM the growth and sustainenece should be focused as mentioned.
2016-01-29 10:17
Simon your earlier 1637 call really did its job. Luckily I follow. 1655 go go go
2016-01-29 10:55
Market is in window dressing. Watch the stocks involved. It will be EPS (Growth and Sustainence) in coming results. Forex is taken as a constant in the equation since the same forex is applied in last 2 quarter and therefore the result will be EPS.
2016-01-30 20:06
We are seeing a catch 22 situation where export stock is concern. Many sold because of the stronger rebound in ringgit. If we look at the sector that is performing, we will see industrial product (i.e. Majority supplying nett export market), plantation, and tech. Tech majority also an export market.
For those who sold export stocks must be sure ringgit rebound can withstand this week. Otherwise the export stock will rebound and many will be left with plantation as the buy option.
If ringgit rebound is imminent, then those who buy plantation will surely benefit because apart from the rising demand, their export demand also have not been factored in last 2 years. The next 2 days we will know which direction. A migration to plantation or selected tech stocks or a support place back at export furniture. A support maybe place back at furniture counter is because this month financial report is a captured report that factored in upto Dec2015 when the exchange rate was prevailing.
2016-02-01 12:30
hi simon .. i have always wanted to understand this buy rate + volume thingy ! lucky me that i stumbled upon your blog ... u explained it so amazingly well :) thanks so much for sharing ...
2016-03-05 10:02
Post a Comment
Featured Posts


Latest Videos


Apps


Top Articles
1
2
3
TA Sector Research
4
Good Articles to Share
What’s behind the slew of restaurant bankruptcies in 2024? Experts unpack the problems
5
M+ Online Research Articles
6
Good Articles to Share
7
MQ Market Updates
8
Good Articles to Share
Four convicted in Spain over homophobic murder that sparked nationwode protests
#
Stock
Score
Daily Stocks
Stock Name
Last
Change
Volume
Stock Name
Last
Change
Volume
Stock Name
Last
Change
Volume
MQ Trading Signals
Stock
Time
Signal
Duration
Stock
Time
Signal
Duration
Featured Advertisers / Partners


Ride The Bull Short The Bear
CS Tan
4.9 / 5.0
This book is the result of the author's many years of experience and observation throughout his 26 years in the stockbroking industry. It was written for general public to learn to invest based on facts and not on fantasies or hearsay....
HakChai
SimonShuet, lneed your help to look and advice on E&O. Thank you Sir
2016-01-28 14:57