


investment knowledge
Maybank: OPR hikes benefits only banks, says Guan Eng. This is an invalid Statement from my empirical studies

investingiscommonsen
Publish date: Tue, 26 Dec 2023, 03:31 PM
investingiscommonsen
0 15
this is the place where I share investment knowledge
Hi, I am investingiscommonsense, I am going to discuss with you about Maybank, especially the validity of the statement” increase in OPR will only benefits the banks ” by Lim Guan Eng, our former finance minister , the relationship between leverage and bank run, and Maybank’s dividend reinvestment plan which is similar to rights issue in my personal opinion. Maybank was ranked first in the KLCI index with the market capitalization of RM107billion on 25 December 2023. It is the leader in digital bank in Malaysia with market share of 46.2% and 58.4% respectively in mobile banking and internet banking transaction volume. It is the largest Islamic bank in Malaysia and the 5th largest in the world in terms of asset size. It has 967 retail and 38 investment banking branches in Asean.
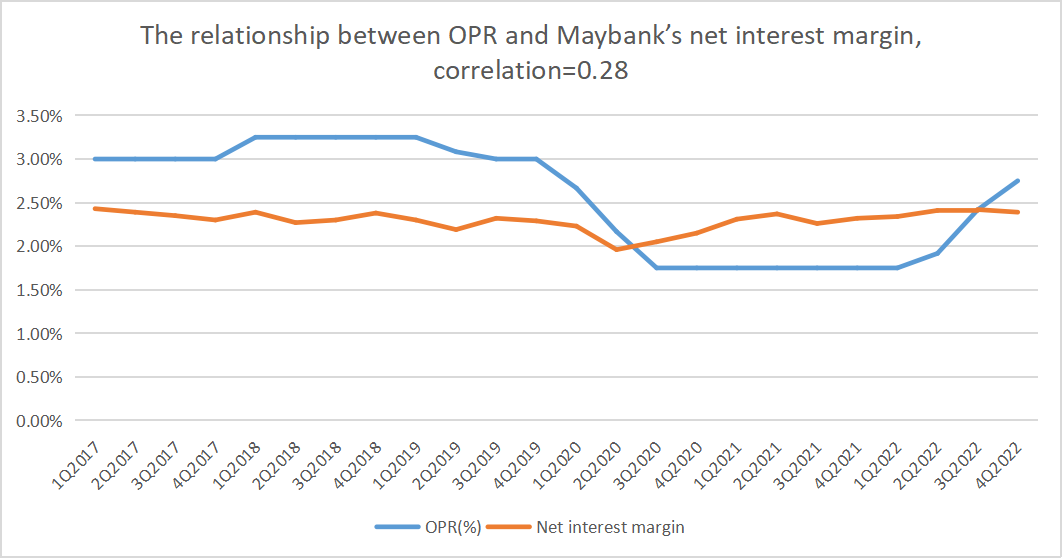

How do banks earn money? There are two sources of income : fund based income and fee based income. Fund based income includes the loans granted to individuals and businesses. For individuals, the banks provide personal loans, mortgage loans, education loans , car loans and others. For businesses, the loans are similar to individuals but also include working capital loans, equipment financing , invoice financing and others . The banks fund the loans by taking deposits and introducing financial instruments like money market instruments like certificate of deposits , commercial papers and repurchase agreements to investors. The banks receive deposits at lower interest rates and lend the loans at higher interest rates , the difference between interest expense and interest income is the profit for a bank. For example, an individual puts money into a Maybank’s fixed deposit account for a period of 1 year for 2.8% interest rate and Maybank lends a housing loan to another individual at 4.5% interest rate, Maybank earns 1.7% from the spread which is called net interest margin. Similarly, the banks can sell the money financial instruments to investors at lower interest rates and lend the loans at a higher interest rate. This is another hypothetical example, Maybank issued RM1.24 billion Islamic additional tier 1 capital securities at 4.08% interest rate to investors , and the proceeds will be utilized as loan for businesses for capital investment purpose for 6.5% interest rate. Maybank earns 2.42% net interest margin. There are two schools of thought on the impacts of the interest rates on the banking industry’s profitability. On one hand, increasing interest rate will increase banking industry’s profitability. The reason is that the banks can charge higher interest rates on the loans more quickly than that of deposit rates, this view was supported by our former finance minister, Lim Guan Eng. He mentioned that only banks have gained from OPR hikes to 3 percent in May 2023. On the other hand, increasing interest rate will decrease banking industry’s profitability because the customers like to put money into fixed deposit accounts when interest rate is high causing net interest margin to drop due to strong competition between the banks to increase the funding cost to entice the clients, and there is lesser demand for the loans. For example, in 1H2023, Malaysian OPR increased to 2.83% from 1.83% in the corresponding period of the previous year, however Maybank’s net interest margin dropped to 2.16% from 2.38% during the same period arising from continued deposit competition. If we analyze the relationship between OPR and Maybank’s net interest margin, the result is negligible correlation.OPR and Maybank’s net interest margin does not move in parallel, when OPR increased to 3.25% in 2018 from 3% in the preceding year, the Maybank’s net interest margin in 2018 did not increase in the same proportion but maintained at the more or less the same level as when OPR was 3% in 2017. When Bank Negara reduced OPR to the average of 2.1% in 2020 to revive the economy due to Covid 19 from the average of 3.1% in 2019, the Maybank’s net interest margin decreased marginally from 2.28%in 2019 to 2.1% in 2020. From the examples given, OPR is not the determinant of net interest margin of Maybank, the reasons could be strong deposit competition, the banks will increase deposit rates eventually to catch up with OPR , the loans are repaid at lower interest rates when they are low.
Apart from that, Maybank has non interest income. To a normal person like us, ATM card fees, loan agreement fees, safety deposit fees, brokerage fees are the most common types of non interest income. Maybank’s non interest income includes commission, service charges and fees like asset management fees, corporate advisory fees, brokerage income, fees on loans advances and financing. Treasury& market income like trading income and investment income, foreign exchange profit, unrealized/realized gain on financial assets/ liabilities and derivatives. Insurance income and other income. Over the 6 year period, non interest income accounts for 38% of net operating income.
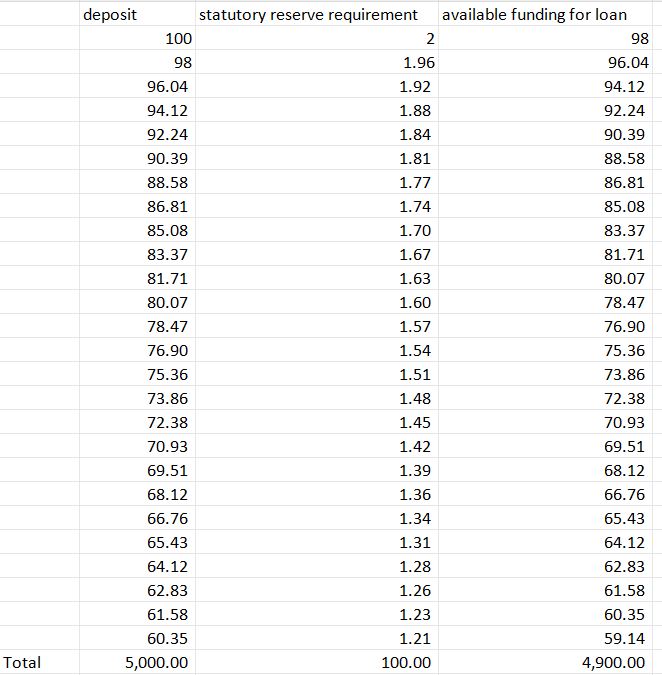

The banking industry is tied with monetary policy and largely about leverage. Statutory reserve requirement is enforced by Bank Negara Malaysia to manage money supply. When the inflation is high, Bank Negara can reduce money supply by increasing statutory reserve requirements , the banks need to put more eligible liabilities as reserve in Bank Negara and vice versa. Currently, statutory reserve requirement is 2% which indicates the banks in Malaysia needs to maintain 2% of eligible liabilities as reserve at Bank Negara which is interest free. Eligible liabilities is defined as ringgit denominated deposits and non-deposit liabilities, net of inter bank assets and placements with the Bank with additional adjustments. So, what is the relationship between statutory reserve requirements and leverage? For example, When customer A deposits RM100 into a savings account, Maybank needs to put 2% of RM100 as statutory reserve requirement and lends the remaining amount which is RM98. Customer B borrows RM98 from Maybank and spends the money in a restaurant, then restaurant owner saves the money in Maybank. Maybank needs to put RM1.96 as reserve in Bank Negara and lends the remaining amount which is RM96. The examples go on and on . In the end, with the initial deposit of RM100, Maybank can have the total of RM5000 deposit, of RM4900 loan amount to clients and of RM100 as statutory reserve requirement due to the multiplier effect. Customers’ deposits are a loan for Maybank.


Over the years, the leverage ratio of Maybank which is defined as debt to equity is 10, which means 90% of assets are financed by debts, while 10% of of assets are financed by equity. If everyone is withdrawing money at the same time from Maybank which is similar to every debtor asking Maybank to repay the loans, then Maybank will collapse, because Maybank does not have enough funds in the short term. The business model of banking industry is maturity transformation which means the maturities of customers’ deposits are short term while that of loans are long term.
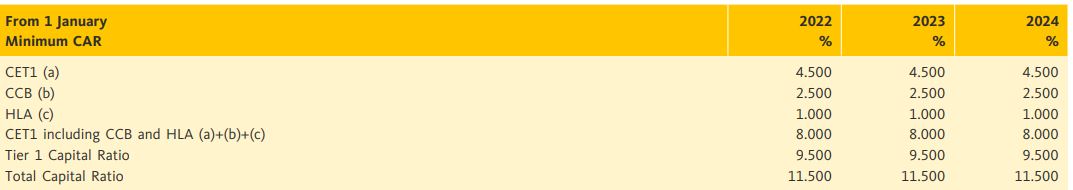
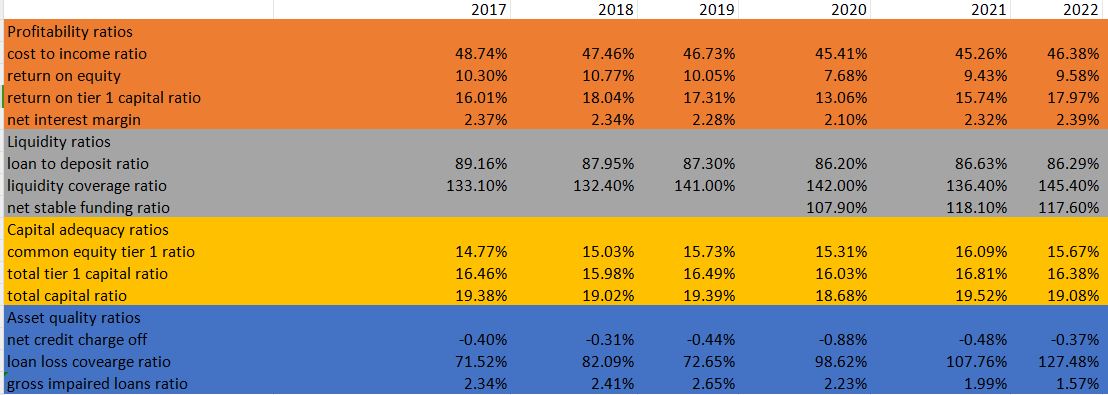

Maybank’s growth rate is rather stagnant, operating revenue grew at a 5 year CAGR of 2.2%, operating profit at 4%, net profit at 1.4% from 2017 to 2022. Maybank’s ROE ranged from 7.68% and 10.77% over the 6 year period. The particularly low ROE in 2020 was due to the management foresaw potential deteriorating assets quality owing to Covid 19 pandemic and hence doubled the allowances for impairment losses on loans, advances, financing and other debts to RM4.59billion. However, ROE is not the best methodology to measure the profitability of banks, because this is a measure for the return of shareholders. A better formula is return on tier 1 capital . Tier 1 capital is the core capital amount for bank business. I define return on tier 1 capital as operating profit/ tier 1 capital. Over the years, Maybank’s return on tier 1 capital ranged from 13.06% to 18.04%. If the number was around 13%, it indicated Maybank could generate 13cents operating profit out of RM1 capital. Operating profit is used is to make sure the comparability and avoid the differences in tax treatments and non core earnings like share of profits in associates and joint ventures. Over the 6 year period, the net interest margin produced by Maybank ranged from 2.1% and 2.39%. The cost to income ratio was around 47% during the same period. Maybank’s loan to deposit ratio stood at around 87% during the same period which indicates the liquidity risk was acceptable because it was under 100%. The loan to deposit greater than 100% indicates a decline in deposit or a significant loan default could threaten the viability of a bank or the bank needs to borrow money to lend the loans, and hence lower net interest margin. If the ratio is too low, the banks might have opportunity cost because the deposits siting there without interest income. The banks need to maintain a proper ratio to maximize income potential. The liquidity coverage ratio issued by Bank Negara Malaysia on 25 August 2016 is to measure whether the banks can withstand serious liquidity stress scenario over a 30 day period. Anything above 100% is considered good. The average 6 year liquidity coverage ratio was 138%. It was meant that Maybank had enough high quality liquid assets to fulfil liquidity requirements for the next 30 days. Net stable funding ratio is another liquidity ratio issued by Bank Negara that complements with liquidity coverage ratio to measure liquidity risk for a period of 1 year. Anything above 100% is considered good. The average 3 year net stable funding ratio was 115% for Maybank. It was meant that Maybank had enough funding to meet assets and off balance sheet activities for a year. Capital adequacy ratio compares a bank’s capital against risk weighted assets. The purpose is to measure whether a bank has enough funds to cover losses and remain solvent under difficult financial times. There are 3 capital adequacy ratios which are common equity tier 1, tier 1 capital,and total capital. The banks need to maintain 4.5%, 6%, and 8% of respective ratios against risk weighted assets. There are additional capital buffer requirements for different banks. For Maybank in 2023, minimum common equity tier 1, tier 1 and total capital were4.5%,9%,11.5% respectively. As Maybank had average of 15.43% common equity tier 1 ratio,16.36% total tier 1 capital ratio,19.18% total capital ratio, Maybank was relatively stable from the solvency point of view. The asset quality indicators are loan loss coverage, gross impaired loan and net charge off. The gross impaired loan ratio was declining from 2.34% in 2017 to 1.57% in 2022, it indicated that Maybank had lower percentage of non performing loans out of total loans, the clients’ quality was improving. As I mentioned before, in 2020 Maybank doubled the allowances for impairment losses on loans, advances, financing and other debts, and hence the net credit charge off rate jumped to 0.88% causing the loan loss coverage improved substantially to 98.62% and thereafter. Therefore, Maybank had set aside enough funds to cover non performing loans starting from 2020.
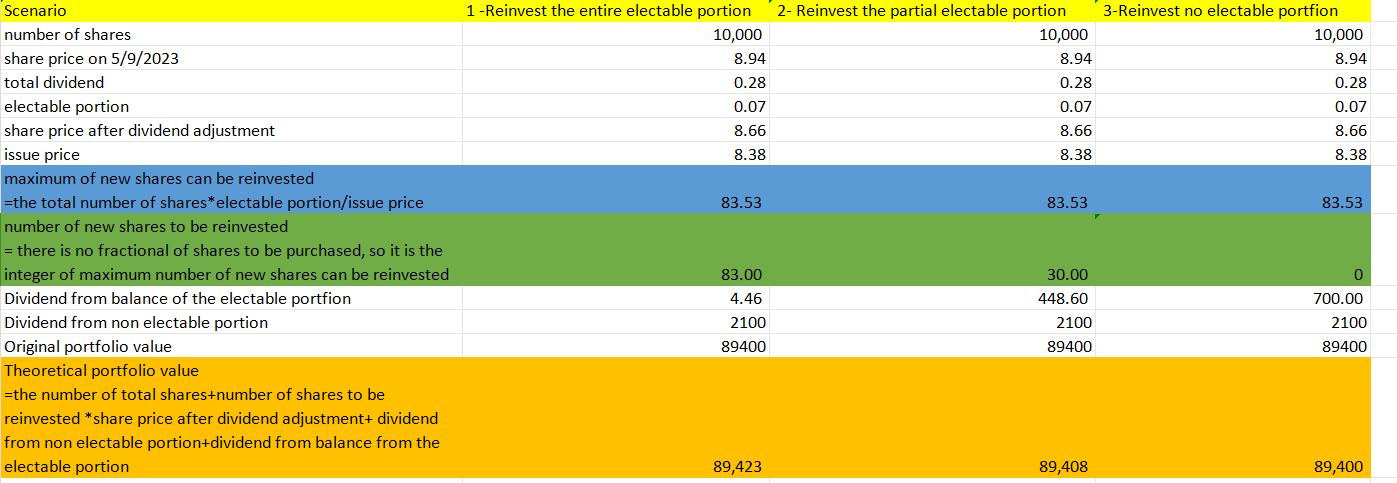

Maybank has a dividend reinvestment plan which is similar to rights issue in my personal opinion. The difference is that the shares purchased from dividend reinvestment plan is paid by dividend while the shares from rights issue are the shareholders needs to take money out from the pockets to purchase them. For example, Maybank’s 23rd Dividend Reinvestment Plan (DRP) in conjunction with the First Interim Dividend for Financial Year Ended 31 Dec 2022 offered the shareholders to buy a new share at RM8.38 which was 3.23% discount to the Volume Weighted Average Market Price of RM8.94 or RM8.66 after dividend adjustment up to and including 2 September 2022. The dividend was RM0.28, of which RM0.07 electable portion could be chosen to reinvest to buy the new shares or receive dividend payment, RM0.21 was non electable portion which means the shareholders will receive dividend payment only. Assuming shareholder ABC had 10,000 shares with the share price of RM8.94 on 5 September 2022, the portfolio value was RM89,400. I am showing you 3 scenarios. In the first scenario, shareholder ABC chose to reinvest the entire portion of electable in new shares, the shareholder would increase 83 additional shares which was derived from the total number of shares*electable portion/issue price=(10,000*0.07)/RM8.38 and the total amount of shares would increase to 10,083, the theoretical portfolio value would be the number of total shares *share price after dividend adjustment+ dividend from non electable portion+dividend from balance from the electable portion= 10,083*RM8.66+RM2,100+RM4.46=RM89,423. In the second scenario , the shareholder chose to reinvest the partial portion of electable , let’s say 30 new shares, the theoretical portfolio value would be 10,030*RM8.66+RM2,100+RM448.60=RM89,408. In the third scenario , the shareholder chose to reinvest no electable portion, then the portfolio value would be 10,000*RM8.66+RM2,100+RM700= RM89,400. Let’s compare the first scenario with the third scenario which are the shareholder chose to reinvest the entire electable portion and reinvest no electable portion, the difference in the amount of shares is 10,083-10,000=83 shares or 0.8%. It is meant that there would be shares dilution of 0.8% if the shareholder chose not to reinvest the electable portion. This 0.8% might look small. However, over the long term, there is a huge difference.


From 2017 to 2022, the number of shares increased 11.79% from 10,782,745,000 to 12,054,127,000,of which 1,097,333,000 or 10.18% was attributable to the new shares issued under the dividend reinvestment plan. Therefore, if the shareholder chose not to reinvest any electable portion since 2017 until 2022, there would be dilutive effect of 9.24% due to not to reinvest any electable portion under the dividend reinvestment plan . If we divided RM8,234,949,000 net income to equity shareholders in 2022 by the shares issued of 10,782,745,000 in 2017, the eps was RM0.7637 compared to RM0.6932 using the total of new shares issued from dividend reinvestment plan from 2018 to 2022 plus the number of shares in 2017. The difference between RM0.6932 and RM0.7637 is 9.24% which is also the dilutive effect for the shareholder not to reinvest any electable portion of dividend since 2017.
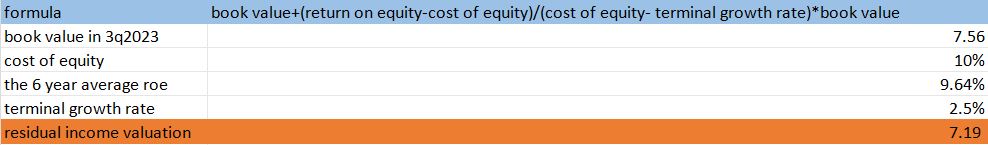

In the journal of Bank Valuation Models – A Comparative Analysis,Prof. Chitra Gunshekhar Gounder and Dr. M. Venkateshwarlu discussed that residual income valuation model was more superior to value a bank’s equity value compared to relative valuation model like P/E and P/B in the context of Indian Banks. There was a positive significant relationship between the intrinsic value of banks determined by residual income valuation model and market price of share in all the cases including Indian Private Sector Banks, Indian Public Sector Banks and Commercial banks by performing correlation and regression studies. I am using single stage residual income valuation instead of multistage residual income valuation to value Maybank because it had a lack of growth as I mentioned before. The formula of single stage residual income valuation is book value+(return on equity-cost of equity)/(cost of equity- terminal growth rate)*book value. In the 3Q2023 quarterly report, the book value was RM7.56. The cost of equity is 10% as the growth rate is low in the recent years, 6 year ROE is 9.64% which is not impressed, banking industry is highly levered. The terminal growth rate is 2.5% which is the average of the cagr of revenue, operating profit and net income. Valuation deriving from residual income valuation is = 7.19=7.56*+(9.64%-10%)/(10%-2.5%)*7.56. The fundamental driver is ROE for residual income valuation, since Maybank’s ROE is lower than cost of equity, and hence the valuation derived from residual income valuation is lower than book value.
Disclaimer
If you like my analysis, please follow my social media: Facebook , Youtube , you can watch my analysis of Maybank in a video format on Youtube.
This information is intended for educational purposes only. It shall not be understood or construed as, financial advice. It is very important to do your own analysis before making any decision
Hi, I am Lim Khai Woon. I passed CFA program in 2 years and achieved a distinction for my master degree in Finance, Investment and Risk from University of Kent .I was a senior investment analyst in a family office and a financial analyst in a physical commodity trading firm.
I will be providing an investment course for the participants who want to learn comprehensive fundamental investing. It is a 2 day training that will be conducted over the weekend that costs RM5,000. The course can be conducted in either English or Mandarin, but it will be taught separately. The date is not decided yet. The location will be held in Selangor/ Kuala Lumpur subject to availability of the training rooms . Other locations(e.g. Johor, Penang) can be considered if there are enough students interested to participate in the course.
If you are interested in learning the stock analysis from me , please fill up the google form.
https://docs.google.com/forms/d/19sr1vRPDctEmkN9Sx1bzjSDp6ff_XuypJHp7zJiGLlo/viewform?fbclid=IwAR2lN7hxdi9fYEovDp66h6XEHbDufW7_wJ1Nr-ScsmdH6fvMQ26wJkyTadQ&edit_requested=true
My email address is : investingiscommonsense@gmail.com
I am also providing the service of building the financial models for companies. If any company is interested, please fill up
or contact me by my email
https://docs.google.com/forms/d/1WLiYr4q8MRH6cu4mytyghaTaoPEDdF0jxHiT751Tsxg/edit
Sources
1:https://www.nst.com.my/news/nation/2023/05/912924/opr-hikes-benefit%C2%A0only-banks-says-guan-eng
2" Annual Reports of Maybank
3: Annual General Meeting
4: Quarterly Reports
5: Company Website
6: Bursa Malaysia
7: Results briefing
8:https://www.sciedupress.com/journal/index.php/afr/article/download/11948/7373
More articles on investment knowledge
Part 1 :Mega First Corporation Berhad is FULLY valued
Created by investingiscommonsen | Nov 14, 2023
Petronas Chemicals Group's RM 10billion investment in Perstorp is FUTILE
Created by investingiscommonsen | Oct 23, 2023
Discussions
Be the first to like this. Showing 0 of 0 comments
Post a Comment
Featured Posts
New Update. Discover investment communities that resonate with your ideas
Latest Videos

Apps


Top Articles
1
How to become a resilient trader
2
TA Sector Research
3
4
5
AmInvest Research Reports
7
8
#
Stock
Score
Daily Stocks
Stock Name
Last
Change
Volume
Stock Name
Last
Change
Volume
Stock Name
Last
Change
Volume
MQ Trading Signals
Stock
Time
Signal
Duration
Stock
Time
Signal
Duration
Featured Advertisers / Partners


Ride The Bull Short The Bear
CS Tan
4.9 / 5.0
This book is the result of the author's many years of experience and observation throughout his 26 years in the stockbroking industry. It was written for general public to learn to invest based on facts and not on fantasies or hearsay....