


iVSA Stock Review
Holistic View of CSC Steel with Fundamental Analysis & iVolume Spread Analysis (iVSAChart) –26 April

Background
CSC Steel Holdings is a flat steel producer in Malaysia. It was listed on Main Board of Bursa Malaysia in December 2004. The group’s core products are various types of steel coils.
|
Financial Summary (2012 to 2015) |
|
Key Data |
|
|||||
|
Financial Year |
2012 |
2013 |
2014 |
2015 |
|
Price @ 26/4/16 |
RM 1.41 |
|
|
Revenue (RM mil) |
1034.7 |
1141.7 |
1048.5 |
1018.0 |
|
Listing |
Main Board |
|
|
Net Profit (RM mil) |
69.2 |
29.1 |
(21.3) |
54.6 |
|
Market Cap (RM mil) |
516.29 |
|
|
Operating Profit Margin (%) |
3.3 |
3.4 |
-2.5 |
6.3 |
|
NTA (RM) |
2.09 |
|
|
Total Debts (RM mil) |
- |
- |
- |
- |
|
P/E Ratio |
9.46 |
|
|
Cash On Hand (RM mil) |
236.8 |
260.0 |
210.4 |
231.4 |
|
ROE (%) |
7.09 |
|
|
DPS (RM) |
0.07 |
0.07 |
0.03 |
0.08 |
|
NCAV (RM) |
1.40 |
|
|
Debt to Equity Ratio (%) |
9.63 |
8.15 |
8.67 |
6.53 |
|
Dividend Yield (%) |
5.56 |
|
|
Current Ratio |
13.66 |
16.05 |
12.37 |
18.90 |
|
Cash Ratio |
7.74 |
|
Strong Recovering Financials
Steel coil price has seen a downtrend since end of 2014 and dropped to its lowest in over a decade in 2015. Despite this, CSC has made a comeback in 2015 due to lower production cost where its operating profit margin has strengthen substantially. CSC is trading in the same range as its NCAV and at 33% discount to its NTA, which suggests it’s undervalue in terms of assets. CSC has also been declaring dividend every year since 2008 with a current dividend yield of 5.56%, which is an added bonus.
Recent Developments
Land Acquisition – Late 2015, CSC steel acquired two pieces of leasehold land together with a factory building at Seberang Perai Tengah for RM41m. It is expected to generate more than RM3.18m per year through rental income from existing tenancies. This is a great investment which will see recurring income.
Disposal of loss making unit – In August 2015, CSC disposed its wholly-owned subsidiary CSC Bio-Coal Sdn Bhd for RM1m after having made losses for 3 consecutive years since 2012. This suggests that the management are heading in the right direction to strengthen the company.
iVolume Spread Analysis (iVSA) & comments based on iVSAChart software – CSC Steel
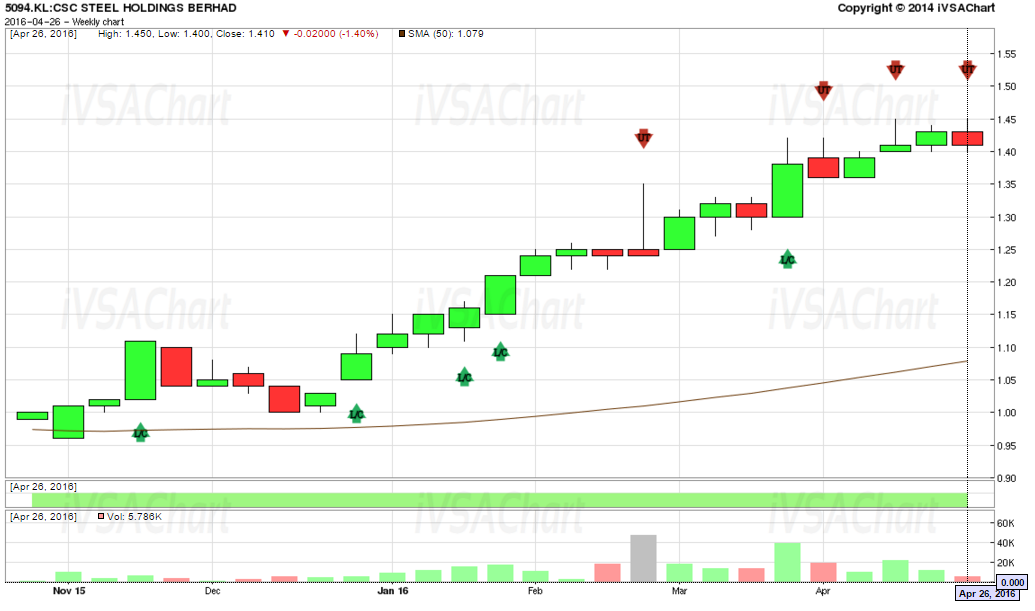
Up-trending Stock with sign of weakness expected ahead – Looking at the iVSAChart of CSC Steel, it has been on an uptrend since the breakout in Jan 2016. However, the recent sign of weakness (red down arrow) indicating potential profit taking or sideway market at best. Wait for more sign of strengths around RM1.30 - RM1.40 level before buying/accumulating.
Our View - We favour CSC Steel as it has strong recovering financials with the highest operating profit margin of 6.30% in the past 5 years and is trading at a 33% discount to its NTA. Additionally, as CSC Steel has acquired more land, we believe going forward CSC Steel can continue to record high operating margins for years to come. However, current timing is not good as we are seeing many sign of weaknesses on iVSAChart. We need to see more sign of strengths (green up arrow) on iVSAChart first before accumulating.
Any Query?
- WhatsApp: +6011 2125 8389/ +6018 286 9809
- Email: sales@ivsachart.com
- Follow us on Facebook: https://www.facebook.com/priceandvolumeinklse/ and website https://www.ivsachart.com/events.php
This article only serves as reference information and does not constitute a buy or sell call. Make your own assessment before deciding to buy or sell any stock.
Related Stocks
| Chart | Stock Name | Last | Change | Volume |
|---|
Market Buzz
More articles on iVSA Stock Review
Holistic View of Leon Huat with Fundamental Analysis & iVolume Spread Analysis (iVSAChart)
Created by Joe Cool | Dec 15, 2016
Holistic View of Tomypak with Fundamental Analysis & iVolume Spread Analysis (iVSAChart)
Created by Joe Cool | Dec 15, 2016
Holistic View of ECS IT with Fundamental Analysis & iVolume Spread Analysis (iVSAChart)
Created by Joe Cool | Dec 01, 2016
Holistic View of Magni-Tech with Fundamental Analysis & iVolume Spread Analysis (iVSAChart)
Created by Joe Cool | Dec 01, 2016
Holistic View of Teo Seng with Fundamental Analysis & iVolume Spread Analysis (iVSAChart)
Created by Joe Cool | Nov 14, 2016
Holistic View of QL Resources with Fundamental Analysis & iVolume Spread Analysis (iVSAChart)
Created by Joe Cool | Nov 03, 2016
Holistic View of Top Glove with Fundamental Analysis & iVolume Spread Analysis (iVSAChart)
Created by Joe Cool | Oct 24, 2016
Holistic View of Scientex with Fundamental Analysis & iVolume Spread Analysis (iVSAChart)
Created by Joe Cool | Oct 24, 2016
Holistic View of KESM with Fundamental Analysis & iVolume Spread Analysis (iVSAChart)
Created by Joe Cool | Oct 17, 2016
Featured Posts


Latest Videos


MQ Trading Signals
Time
Signal
Duration
Type
2024-07-17 10:40:00
EMA 5
10 Mins
BUY
Apps


Top Articles
1
南洋行家论股
3
The Alpha Trader
4
BreakingOut
5
Koon Yew Yin's Blog
6
Bursa Stock Musings - Thoughts & Ideas
PGF Capital - insti shareholding up from 5% to 14%! (part 1)
7
BFM Podcast
8
How to become a resilient trader
#
Stock
Score
Daily Stocks
Stock Name
Last
Change
Volume
Stock Name
Last
Change
Volume
Stock Name
Last
Change
Volume
Featured Advertisers / Partners


Ride The Bull Short The Bear
CS Tan
4.9 / 5.0
This book is the result of the author's many years of experience and observation throughout his 26 years in the stockbroking industry. It was written for general public to learn to invest based on facts and not on fantasies or hearsay....