


iVSA Stock Review
Holistic View of Eduspec with Fundamental Analysis & iVolume Spread Analysis (iVSAChart)

Profile
-
Listed on 24 November 2005
-
A component of the FBM ACE Index under the Other Consumer Services industry
-
Market Capitalisation of RM 215 million
-
Financial Year End 30 September 2016
-
Currently in the 3rd Quarter
-
3rd Quarter results ending 30 June 2016 to be announced by August 2016
Background and Core Business
-
Investment holding company dealing with the development and promotion of IT learning programs and services (Education Technology solutions and services)
-
These are divided into three core activities i.e. STEM (Science, Technology, Engineering and Mathematics), Digital School and IESS (Integrated Education Solutions and Services)
-
Provides these services to kindergartens, primary and secondary schools
-
Currently looking to expand into Thailand and Philippines
Financial Brief and Ratios (Historical)
|
Eduspec (0107.KL) |
FY 2015 (RM’000) |
|
Revenue (RM’000) |
76,008 |
|
Net Earnings (RM’000) |
9,790 |
|
Net Profit Margin (%) |
12.88 |
|
EPS |
1.21 |
|
PE Ratio (PER) |
23.35 |
|
Dividend Yield (%) |
N/A |
|
ROE |
9.77 |
|
Cash Ratio |
0.690 |
|
Current Ratio |
4.34 |
|
Debt to Equity Ratio |
0.176 |
-
Revenue has experienced a y-o-y growth of +30% with net earnings and EPS growth of +42%
-
PER is as expected for a growing company like Eduspec
-
Eduspec has not declared any dividend payments
-
ROE is considerably on the low side
-
The company’s gearing is low
iVolume Spread Analysis (iVSA) & comments based on iVSAChart software – Eduspec
-
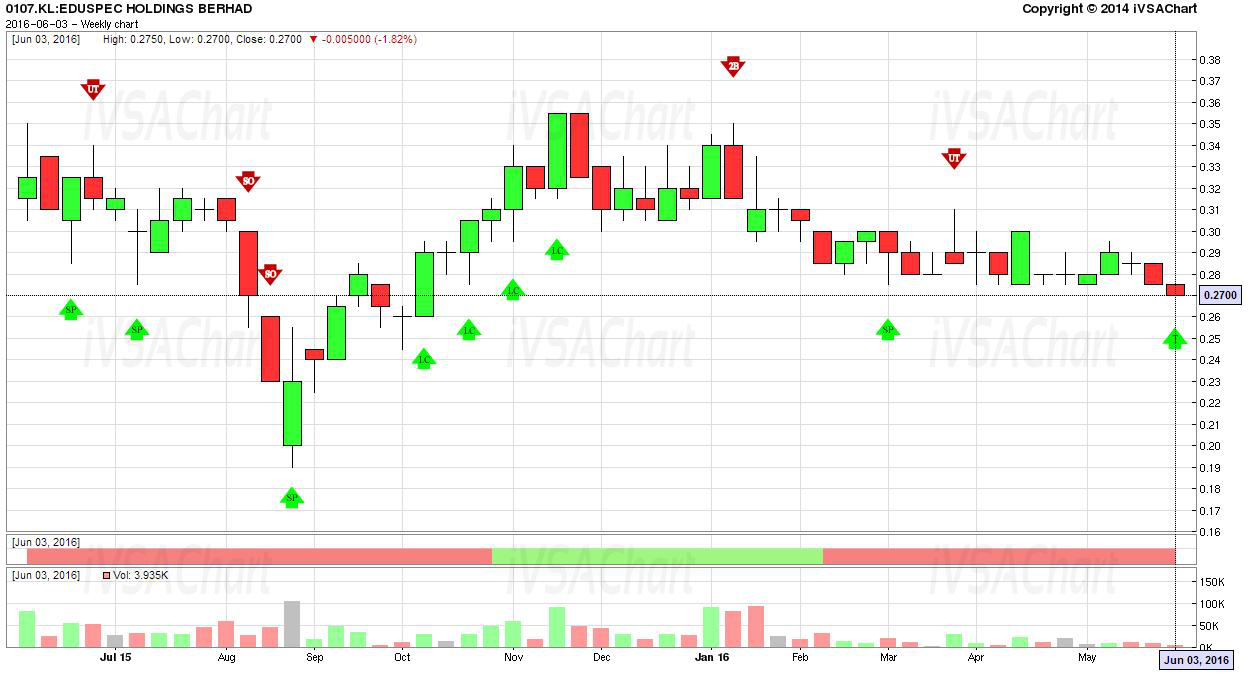
This is the one-year weekly chart for Eduspec ending 3 June 2016
-
Strong hands emerged to buy the stock in late August 2015 as shown by the Sign of Strength (green arrows) putting a halt to the prior sell offs
-
Prices subsequently resumed its sideways congestion
-
Heavy supply was met around the RM0.34 – RM0.35 level and prices retreated back to the trading range
-
Sign of Weakness (red arrow) appeared in March this year indicating more supply around the RM0.30 level
-
In spite of that, prices remained resilient and moved sideways with low volume hinting at possible accumulation
-
For the week ending 3 June 2016, a Sign of Strength (green arrow) appeared which puts the odds in favor of accumulation
-
Traders/investors should take note that if prices start to rally from this level with bullish volume then we are likely to be looking at a commencement of an uptrend
Any questions?
- Website https://www.ivsachart.com/events.php
- Email: sales@ivsachart.com
- WhatsApp: +6011 2125 8389/ +6018 286 9809
- Follow & Like us on Facebook: https://www.facebook.com/priceandvolumeinklse/
This article only serves as reference information and does not constitute a buy or sell call. Make your own assessment before deciding to buy or sell any stock.
Related Stocks
| Chart | Stock Name | Last | Change | Volume |
|---|
More articles on iVSA Stock Review
Holistic View of Leon Huat with Fundamental Analysis & iVolume Spread Analysis (iVSAChart)
Created by Joe Cool | Dec 15, 2016
Holistic View of Tomypak with Fundamental Analysis & iVolume Spread Analysis (iVSAChart)
Created by Joe Cool | Dec 15, 2016
Holistic View of ECS IT with Fundamental Analysis & iVolume Spread Analysis (iVSAChart)
Created by Joe Cool | Dec 01, 2016
Holistic View of Magni-Tech with Fundamental Analysis & iVolume Spread Analysis (iVSAChart)
Created by Joe Cool | Dec 01, 2016
Holistic View of Teo Seng with Fundamental Analysis & iVolume Spread Analysis (iVSAChart)
Created by Joe Cool | Nov 14, 2016
Holistic View of QL Resources with Fundamental Analysis & iVolume Spread Analysis (iVSAChart)
Created by Joe Cool | Nov 03, 2016
Holistic View of Top Glove with Fundamental Analysis & iVolume Spread Analysis (iVSAChart)
Created by Joe Cool | Oct 24, 2016
Holistic View of Scientex with Fundamental Analysis & iVolume Spread Analysis (iVSAChart)
Created by Joe Cool | Oct 24, 2016
Holistic View of KESM with Fundamental Analysis & iVolume Spread Analysis (iVSAChart)
Created by Joe Cool | Oct 17, 2016
Featured Posts


Latest Videos


MQ Trading Signals
Time
Signal
Duration
Type
2024-07-17 09:50:00
EMA 5
10 Mins
BUY
2024-07-17 09:30:00
EMA 5
30 Mins
BUY
2024-07-17 09:30:00
EMA 5
10 Mins
SELL
2024-07-17 09:00:00
EMA 5
30 Mins
SELL
2024-07-17 09:00:00
EMA 5
10 Mins
BUY
Apps


Top Articles
1
南洋行家论股
3
The Alpha Trader
4
BreakingOut
5
Koon Yew Yin's Blog
6
Bursa Stock Musings - Thoughts & Ideas
PGF Capital - insti shareholding up from 5% to 14%! (part 1)
7
BFM Podcast
8
How to become a resilient trader
#
Stock
Score
Daily Stocks
Stock Name
Last
Change
Volume
Stock Name
Last
Change
Volume
Stock Name
Last
Change
Volume
Featured Advertisers / Partners


Ride The Bull Short The Bear
CS Tan
4.9 / 5.0
This book is the result of the author's many years of experience and observation throughout his 26 years in the stockbroking industry. It was written for general public to learn to invest based on facts and not on fantasies or hearsay....