


iVSA Stock Review
Holistic View of Kein Hing with Fundamental Analysis & iVolume Spread Analysis (iVSAChart)

Will Kein Hing’s Share Price Recovering to Its Previous High?
Kein Hing International Berhad is a Malaysia-based investment holding company. The Company operates through three business segments:
· Manufacturing, which is engaged in sheet metal forming, precision machining, component assembly, and manufacture and sale of gas appliances in Malaysia and Vietnam;
· Trading, which is engaged in trading of electrical and electronic products, home appliances and gas appliances, and
· Investment holdings.
The Company's subsidiaries are Kein Hing Industry Sdn. Bhd., Kein Hing Muramoto (Vietnam) Co., Ltd, Zenne Infinity Sdn. Bhd., Zenne Appliances Sdn. Bhd., Sanko Kein Hing Sdn. Bhd. and Kein Hing Polychrome (Vietnam) Co., Ltd.
Based on Financial Year (FY) 2015 full year results, Kein Hing` achieved RM 193 million turnover, which is considered to be a small enterprise. Other aspects of the company’s latest financial results are illustrated in the table below.
|
Kein Hing (7199.KL) |
FY 2015 (RM’000) |
|
Revenue (RM’000) |
193,634 |
|
Net Earnings (RM’000) |
3,807 |
|
Net Profit Margin (%) |
1.97 |
|
Return of Equity (%) |
9.76 |
|
Total Debt to Equity Ratio |
0.74 |
|
Current Ratio |
1.27 |
|
Cash Ratio |
-0.004 |
|
Dividend Yield (%) |
0.86 |
|
Earnings Per Share (RM) |
10.12 |
|
PE Ratio |
11.36 |
Since FY2011, Kein Hing’s revenue has seen its ups and downs but generally increase 17% from RM 164 million to RM 193 million in FY2015, with the exception of FY2013 and FY2014 whereby there is a dip in revenue to RM 149 million and RM 159 million respectively as compared to FY2011.
In terms of net profit, Kein Hing’s highest profit record was achieved in FY2011 at RM 9 million and continues to be in a downward trend till today’s RM 3.8 million, with FY2013 achieving a loss of RM 1.1 million. The fluctuation of Kein Hing’s revenue and net profit are mainly due to the stiff competition environment of the electric and electronic industry as the company’s manufactured products are mainly cater for home appliances products, flat panel televisions, printers and automotive parts.
Net profit Margin wise, Kein Hing scores a low 1.97% but it has been improving for the past 3 years, mainly due to its manufactured parts are not of high value added components which could not demand premium in price. Return on Equity is low relatively at 9.76%.
In terms of company’s debt, Kein Hing has a total debt to equity ratio of 0.74 which is considered acceptable as more than half of the company is formed by shareholders’ equity instead of borrowings. The company’s current ratio of 1.27 is acceptable but a slightly negative cash ratio is not a good sign as the company is susceptible to cash flow problems when the economy turns bad. The negative cash flow in FY2015 is mainly due to sudden spike in cash used for acquisition of plant and equipment as well as investment in properties.
Dividend wise, Kein Hing has been paying dividend consistently but the dividend yield percentage is low at 0.86%. The reason behind low dividend payout maybe closely related to the low cash ratio as the company is spending a lot in investing and acquisition of new property, plant and equipment. These capital expenditure efforts could be a key survival step that the company has to take to keep their business competitive in the fast moving electric and electronic sector.
Whether will Kein Hing’s share price rebound to its previous top will be highly depended on the upcoming quarterly earnings per share results as we have seen price and volume evidence in recent weeks (refer to iVSAChart comments below).
Next quarterly results announcement should be on the month of Jun 2016 for Q4 results.
iVolume Spread Analysis (iVSA) & comments based on iVSAChart software – Kein Hing
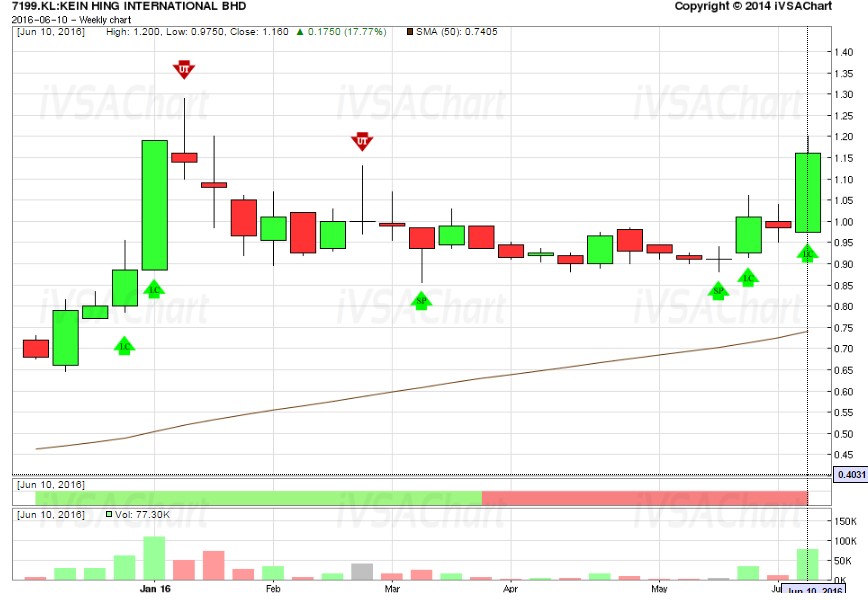
Kein Hing has been building nice classical accumulation since Feb 2016. There were 3 Sign Of Strength (green arrows) in the past 4 weeks with line change breakout from the RM1.06 – RM1.07 resistance level, further confirming that the market is about to move higher.
To essentially break beyond its high of RM1.29, the market need weekly volume to exceed 100K (board lots) at the breakout point. Market is likely to undergo congestion around RM1.20 - RM1.28 levels first.
Consider to accumulate around current level as this is a trade with anticipation of favorable impending quarterly results announcement later this month.
Interested to learn more?
- Website https://www.ivsachart.com/events.php
- Email: sales@ivsachart.com
- WhatsApp: +6011 2125 8389/ +6018 286 9809
- Follow & Like us on Facebook: https://www.facebook.com/priceandvolumeinklse/
This article only serves as reference information and does not constitute a buy or sell call. Conduct your own research and assessment before deciding to buy or sell any stock.
Related Stocks
| Chart | Stock Name | Last | Change | Volume |
|---|
More articles on iVSA Stock Review
Holistic View of Leon Huat with Fundamental Analysis & iVolume Spread Analysis (iVSAChart)
Created by Joe Cool | Dec 15, 2016
Holistic View of Tomypak with Fundamental Analysis & iVolume Spread Analysis (iVSAChart)
Created by Joe Cool | Dec 15, 2016
Holistic View of ECS IT with Fundamental Analysis & iVolume Spread Analysis (iVSAChart)
Created by Joe Cool | Dec 01, 2016
Holistic View of Magni-Tech with Fundamental Analysis & iVolume Spread Analysis (iVSAChart)
Created by Joe Cool | Dec 01, 2016
Holistic View of Teo Seng with Fundamental Analysis & iVolume Spread Analysis (iVSAChart)
Created by Joe Cool | Nov 14, 2016
Holistic View of QL Resources with Fundamental Analysis & iVolume Spread Analysis (iVSAChart)
Created by Joe Cool | Nov 03, 2016
Holistic View of Top Glove with Fundamental Analysis & iVolume Spread Analysis (iVSAChart)
Created by Joe Cool | Oct 24, 2016
Holistic View of Scientex with Fundamental Analysis & iVolume Spread Analysis (iVSAChart)
Created by Joe Cool | Oct 24, 2016
Holistic View of KESM with Fundamental Analysis & iVolume Spread Analysis (iVSAChart)
Created by Joe Cool | Oct 17, 2016
Discussions
2 people like this. Showing 3 of 3 comments
Him sharing his analysis and opinions in assisting traders to make better trading decisions should be applauded.
2016-06-16 16:22
Post a Comment
Featured Posts


Latest Videos

MQ Trading Signals
Time
Signal
Duration
Type
2024-07-17 11:55:00
EMA 5
5 Mins
BUY
2024-07-17 11:50:00
ADX
5 Mins
BUY
2024-07-17 11:20:00
ADX
5 Mins
SELL
2024-07-17 11:05:00
EMA 5
5 Mins
SELL
2024-07-17 11:05:00
TURTLE SYSTEM 20
5 Mins
SELL
Apps


Top Articles
1
南洋行家论股
3
The Alpha Trader
4
BreakingOut
5
Koon Yew Yin's Blog
6
Bursa Stock Musings - Thoughts & Ideas
PGF Capital - insti shareholding up from 5% to 14%! (part 1)
7
BFM Podcast
8
How to become a resilient trader
#
Stock
Score
Daily Stocks
Stock Name
Last
Change
Volume
Stock Name
Last
Change
Volume
Stock Name
Last
Change
Volume
Featured Advertisers / Partners


Ride The Bull Short The Bear
CS Tan
4.9 / 5.0
This book is the result of the author's many years of experience and observation throughout his 26 years in the stockbroking industry. It was written for general public to learn to invest based on facts and not on fantasies or hearsay....
RyanC
This Martin Wong trying to promote his crap software and so-called Wyckoff Method in this forum. Another Sifu from Holland.
2016-06-13 20:28