


iVSA Stock Review
Holistic View of EG Industries with Fundamental Analysis & iVolume Spread Analysis (iVSAChart)

Background and Core Business
EG Industries Bhd was listed on Bursa Malaysia in 1992 and falls under the Electronic Components industry. It also belongs to the Industrial Product Index and FBM Fledgling Index. Principally, it is an investment holding company, with two of its largest subsidiaries SMT Technology Sdn Bhd based in Kedah and SMT Industries Co., Ltd (Thailand) based in Prachinburi specialising in Electronic Manufacturing Services (EMS) for a wide range of electrical and electronic products both in the consumer and industrial sectors.
The EMS involves mainly the assembly of Printed Circuit Boards (PCB), Flex Circuit, Modular Components, and also completed products (box build). These products are used in a wide range of industries i.e. Computer and Peripherals, ICT, Medical Equipment, Measuring equipment, Audio Video, Power Supply, Automobile and Fleet. Because of this, EG Industries serves a wide multinational customer base spanning across Southeast Asia, Korea, Europe and the United States. A few notable renown brands associated with EG Industries include Western Digital and Dyson.
The FY ended on 30th June 2016 and the 4th quarter results would be due around August 2016.
Financial Brief and Ratios (Historical)
|
EG Industries (8907.KL) |
Trailing 12 months (TTM) |
|
Revenue (RM’000) |
751,670 |
|
Net Earnings (RM’000) |
21,121 |
|
Net Profit Margin (%) |
2.81 |
|
EPS (RM) |
0.099 |
|
PE Ratio (PER) |
8.40 |
|
Dividend Yield (%) |
0 |
|
ROE (%) |
9.09 |
|
Cash Ratio |
0.204 |
|
Current Ratio |
1.318 |
|
Total Debt to Equity Ratio |
0.880 |
EG Industries’ revenue has been fluctuating in the past 5 years while its net earnings were growing modestly till 2015 when it experienced a staggering growth of up to nearly 1290% from 2014. However, the revenue growth has turned -14.22% TTM.
Net profit margin has improved since 2015 and is currently 2.81% TTM, with EPS at RM0.099. The company had seen its highest ROE in 2015 at 19% in tandem with the explosive net earnings growth, but has currently settled at 9.09% TTM. PE Ratio stands at a modest 8.40.
Here are a few points to note in terms of the company’s liquidity and cash flow. EG Industries had managed to reduce their reliance on debt, having engaged in a corporate exercise in 2015 involving a 3 for 2 rights issue, with the number of ordinary shares now standing at 211,564,000. While it recorded its highest revenue and net earnings growth in 2015, cash flow from operating activities in fact was negative that year. In terms of capital expenditure, the company had spent up to RM 51 million for investing activities in 2014, the highest over the past 5 years. As it stands today, the company is still experiencing negative free cash flow.
iVolume Spread Analysis (iVSA) & comments based on iVSAChart software – EG Industries
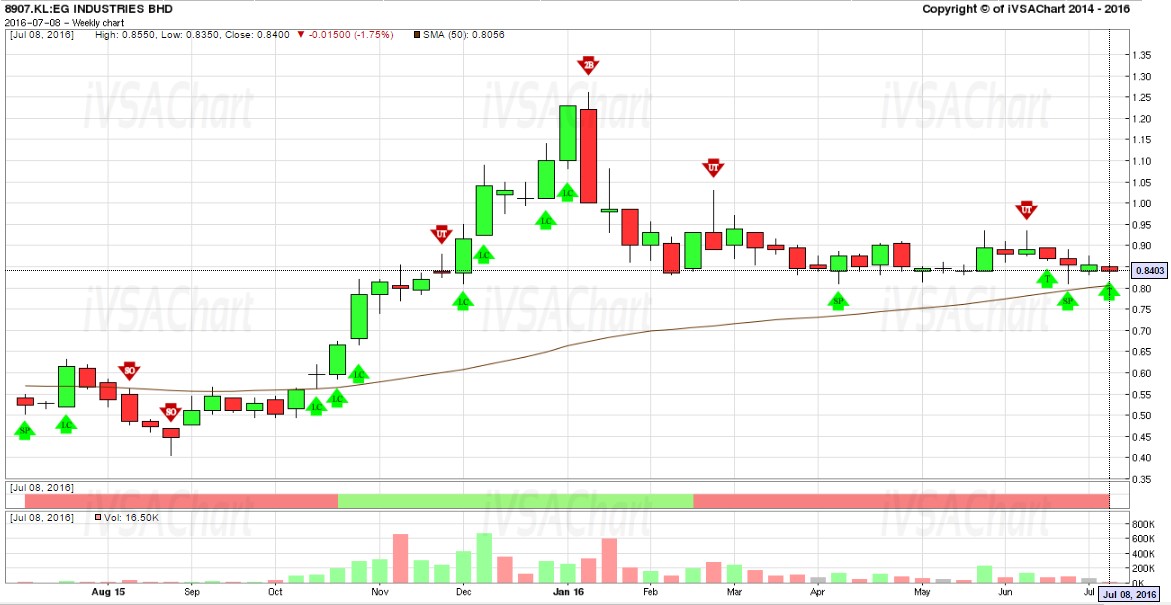
- This is the 1-year weekly chart for EG dating back to Jul 2015
- The stock experienced a run up in price from Oct 2015 till Jan 2016 reaching a high of RM1.26
- Volume for the up bars during the uptrend in Jan 2016 was relatively low denoting a divergence between volume and price, therefore implying insufficient strengths during this Jan 2016 uptrend
- This was confirmed by the Sign of Weakness (red arrow) on the next bar leading to a selloff which later found support around RM0.83 to RM0.81 levels
- Buying interests or support have emerged in the past 3 to 4 weeks as shown by the Sign of Strength (green arrow)
- This could be signs of hidden buying and accumulation by smart money before the next price rally
Interested to learn more?
- Join our Investment & Market Outlook Conference on 28th Aug 2016. Find out more via: https://www.ivsachart.com/investconference2016.php
- Website: https://www.ivsachart.com/events.php
- Email: sales@ivsachart.com
- WhatsApp: +6011 2125 8389/ +6018 286 9809
- Follow & Like us on Facebook: https://www.facebook.com/priceandvolumeinklse/
This article only serves as reference information and does not constitute a buy or sell call. Conduct your own research and assessment before deciding to buy or sell any stock. If you decide to buy or sell any stock, you are responsible for your own decision and associated risks.
More articles on iVSA Stock Review
Holistic View of Leon Huat with Fundamental Analysis & iVolume Spread Analysis (iVSAChart)
Created by Joe Cool | Dec 15, 2016
Holistic View of Tomypak with Fundamental Analysis & iVolume Spread Analysis (iVSAChart)
Created by Joe Cool | Dec 15, 2016
Holistic View of ECS IT with Fundamental Analysis & iVolume Spread Analysis (iVSAChart)
Created by Joe Cool | Dec 01, 2016
Holistic View of Magni-Tech with Fundamental Analysis & iVolume Spread Analysis (iVSAChart)
Created by Joe Cool | Dec 01, 2016
Holistic View of Teo Seng with Fundamental Analysis & iVolume Spread Analysis (iVSAChart)
Created by Joe Cool | Nov 14, 2016
Holistic View of QL Resources with Fundamental Analysis & iVolume Spread Analysis (iVSAChart)
Created by Joe Cool | Nov 03, 2016
Holistic View of Top Glove with Fundamental Analysis & iVolume Spread Analysis (iVSAChart)
Created by Joe Cool | Oct 24, 2016
Holistic View of Scientex with Fundamental Analysis & iVolume Spread Analysis (iVSAChart)
Created by Joe Cool | Oct 24, 2016
Holistic View of KESM with Fundamental Analysis & iVolume Spread Analysis (iVSAChart)
Created by Joe Cool | Oct 17, 2016
Featured Posts


Latest Videos

Apps


Top Articles
1
南洋行家论股
3
The Alpha Trader
4
BreakingOut
5
Koon Yew Yin's Blog
6
Bursa Stock Musings - Thoughts & Ideas
PGF Capital - insti shareholding up from 5% to 14%! (part 1)
7
BFM Podcast
8
How to become a resilient trader
#
Stock
Score
Daily Stocks
Stock Name
Last
Change
Volume
Stock Name
Last
Change
Volume
Stock Name
Last
Change
Volume
MQ Trading Signals
Stock
Time
Signal
Duration
Stock
Time
Signal
Duration
Featured Advertisers / Partners


Ride The Bull Short The Bear
CS Tan
4.9 / 5.0
This book is the result of the author's many years of experience and observation throughout his 26 years in the stockbroking industry. It was written for general public to learn to invest based on facts and not on fantasies or hearsay....
Smallworld
If you are looking for truly indpendent advice then look no further than Martin Wong's The iVSAChart. Whilst Martin is a master of Volume Spread Analysis and looking at price action together with his fundamental analysis, I have found him to always balance his price analysis with an understanding of the fundamentals at play.
2016-07-12 12:14