


iVSA Stock Review
Holistic View of Poh Huat with Fundamental Analysis & iVolume Spread Analysis (iVSAChart)

Background
Poh Huat Resources Holdings Berhad, an investment holding company, engages in processing, manufacturing, trading, and selling wooden furniture and related products in the south-east Asia. It provides office systems; and home furniture systems, including bedroom sets, dining room sets, and home entertainment sets. The company offers its products under the AT Office System and AT Home System brand names.
Poh Huat’s integrated manufacturing facilities are based in Malaysia and Vietnam with total land area of 10 hectares (or 1 million sq. ft.) and 20 hectares (or 2.2 million sq. ft.) respectively. Today, it has a staff force of over 1500 people in the Malaysian plant and 5000 people in the Vietnamese plants. Poh Huat Resources Holdings Berhad is headquartered in Muar, Malaysia.
Based on Financial Year (FY) 2015 full year Poh Huat achieved RM 454 million turnover, which is considered to be a mid-size enterprise. Other aspects of the company’s latest financial results are illustrated in the table below.
|
Poh Huat (7088.KL) |
FY 2015 |
TTM (Apr 2016) |
|
Revenue (RM’000) |
453,933 |
510,198 |
|
Net Earnings (RM’000) |
39,186 |
44,490 |
|
Net Profit Margin (%) |
8.63 |
8.72 |
|
Return of Equity (%) |
19.31 |
20.50 |
|
Total Debt to Equity Ratio |
0.16 |
0.19 |
|
Current Ratio |
1.58 |
1.71 |
|
Cash Ratio |
0.57 |
0.64 |
|
Dividend Yield (%) |
5.41 |
5.72 |
|
Earnings Per Share (Sen) |
17.27 |
19.62 |
|
PE Ratio |
7.54 |
6.86 |
Since FY2011, Poh Huat’s revenue has been experiencing some ups and downs till FY2014 and then a significant increase from then till FY2015. The overall increase within the 5 years equals to 26%.
Net profit wise, Poh Huat achieved a continuous increase these 5 years from RM 5.5 million to RM 39 million, which translates to a 7 times increase in 5 years or average year to year increase of 62.6%. Although Poh Huat’s revenue growth is not smooth, but its smooth net profit growth shows the good cost and overhead control of the company to maintain a good year to year earnings.
Net profit margin wise, Poh Huat scores a good 8.63%, which is average for a manufacturing company, but its Return on Equity at 19.31% is good.
On company’s debt, Poh Huat has very low total debt to equity ratio of 0.16, indicating that the company has extremely little borrowings as compared to its shareholder equity value. The company’s current ratio of 1.58 is healthy and cash ratio of 0.57 is still acceptable.
In terms of dividend, Poh Huat pays a high 5.41% dividend yield, which translates to 8 cents per share in FY2015. Although the dividend yield is high, one notable aspect is that the company’s dividend payout ratio is only at 0.349, which equals to paying out 34.9% of its total net earnings. This indicates that the company still retains a portion of its earnings to further reduce long term debts and capital expenditures. Therefore, shareholders can expect expansion and growths in this company as well as stronger financial status due to reducing debts.
In conclusion, Poh Huat is a mid-size SME. Although revenue track record is not smooth, reflecting the instability of its market share, but the company is strong in cost management to retain earnings, which is showcased in their smooth net earnings growth.
Looking at the Trailing Twelve Months (TTM) financial figures (based on two released quarterly results till April 2016), Poh Huat is expected to have great revenue growth for FY2016 as well as higher net earnings. These are helped by the weakening Ringgit against US dollars and growth of US housing sector which increases the demand of furniture.
Next quarterly results announcement should be on the month of Sep 2016 for Q3 results.
iVolume Spread Analysis (iVSA) & comments based on iVSAChart software – Poh Huat
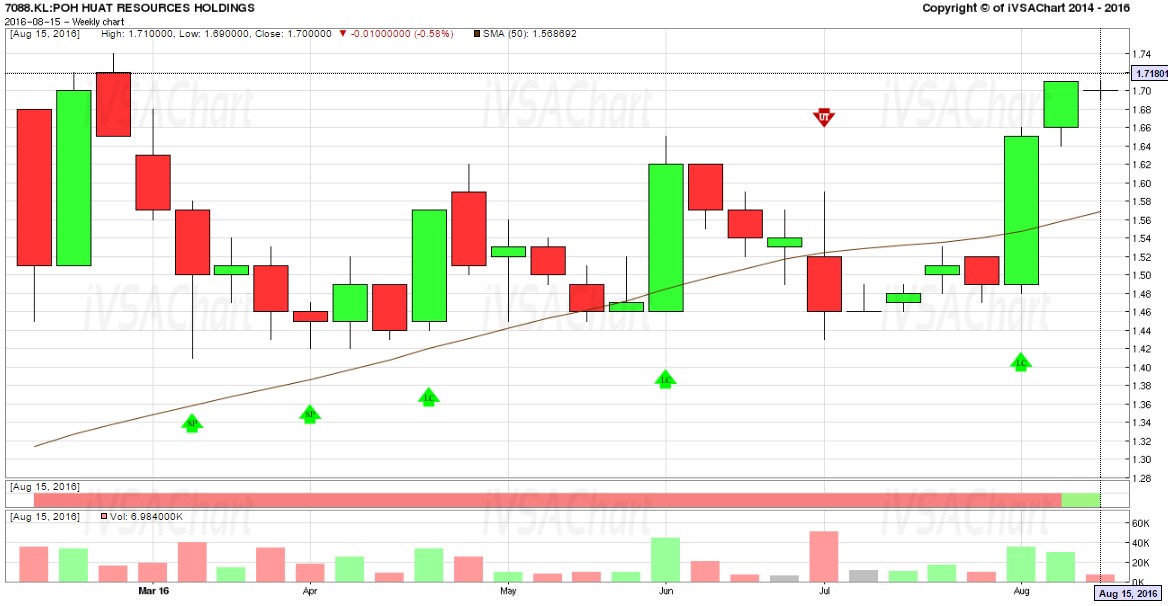
On Poh Huat 6-month weekly iVSAChart, this stock has been moving sideways since around mid-Mar 2016 and several Sign Of Strengths (green arrows) were detected since early April 2016 before the breakout to around RM1.70 level.
At this point, take note that there is a resistance around RM1.72 to RM1.74 level and if you haven’t entered this trade earlier, do look out for more Sign Of Strengths (green arrows) to indicate smart money footprints before accumulating this stock. There should be a convincing breakout of this resistance level accompanied by substantial volume before the uptrend resumes again.
Interested to learn more?
- Join our annual Investment & Market Outlook Conference on 28 Aug 2016. Free door gift WORTH RM50 awaits you. Find out more via: https://www.ivsachart.com/investconference2016.php
- Free eBook available now! Click this URL to get your free eBook of “Get Rich with Dividends by Bill Wermine and Martin Wong”: http://ivsa.getresponsepages.com/
- Find out more about iVSAChart events via: https://www.ivsachart.com/events.php
- Follow & Like us on Facebook via: https://www.facebook.com/priceandvolumeinklse/
- Contact us via: email at sales@ivsachart.com or Call/WhatsApp at +6011 2125 8389/ +6018 286 9809/ +6019 645 3376
This article only serves as reference information and does not constitute a buy or sell call. Conduct your own research and assessment before deciding to buy or sell any stock. If you decide to buy or sell any stock, you are responsible for your own decision and associated risks.
Related Stocks
| Chart | Stock Name | Last | Change | Volume |
|---|
Market Buzz
More articles on iVSA Stock Review
Holistic View of Leon Huat with Fundamental Analysis & iVolume Spread Analysis (iVSAChart)
Created by Joe Cool | Dec 15, 2016
Holistic View of Tomypak with Fundamental Analysis & iVolume Spread Analysis (iVSAChart)
Created by Joe Cool | Dec 15, 2016
Holistic View of ECS IT with Fundamental Analysis & iVolume Spread Analysis (iVSAChart)
Created by Joe Cool | Dec 01, 2016
Holistic View of Magni-Tech with Fundamental Analysis & iVolume Spread Analysis (iVSAChart)
Created by Joe Cool | Dec 01, 2016
Holistic View of Teo Seng with Fundamental Analysis & iVolume Spread Analysis (iVSAChart)
Created by Joe Cool | Nov 14, 2016
Holistic View of QL Resources with Fundamental Analysis & iVolume Spread Analysis (iVSAChart)
Created by Joe Cool | Nov 03, 2016
Holistic View of Top Glove with Fundamental Analysis & iVolume Spread Analysis (iVSAChart)
Created by Joe Cool | Oct 24, 2016
Holistic View of Scientex with Fundamental Analysis & iVolume Spread Analysis (iVSAChart)
Created by Joe Cool | Oct 24, 2016
Holistic View of KESM with Fundamental Analysis & iVolume Spread Analysis (iVSAChart)
Created by Joe Cool | Oct 17, 2016
Discussions
Be the first to like this. Showing 0 of 0 comments
Post a Comment
Featured Posts


Latest Videos


MQ Trading Signals
Time
Signal
Duration
Type
2024-07-17 10:00:00
EMA 5
30 Mins
SELL
2024-07-17 10:00:00
EMA 5
10 Mins
SELL
2024-07-17 10:00:00
ADX
10 Mins
SELL
2024-07-17 09:10:00
EMA 5
10 Mins
BUY
2024-07-17 09:00:00
EMA 5
30 Mins
BUY
Apps


Top Articles
1
南洋行家论股
3
The Alpha Trader
4
BreakingOut
5
Koon Yew Yin's Blog
6
Bursa Stock Musings - Thoughts & Ideas
PGF Capital - insti shareholding up from 5% to 14%! (part 1)
7
BFM Podcast
8
How to become a resilient trader
#
Stock
Score
Daily Stocks
Stock Name
Last
Change
Volume
Stock Name
Last
Change
Volume
Stock Name
Last
Change
Volume
Featured Advertisers / Partners


Ride The Bull Short The Bear
CS Tan
4.9 / 5.0
This book is the result of the author's many years of experience and observation throughout his 26 years in the stockbroking industry. It was written for general public to learn to invest based on facts and not on fantasies or hearsay....