Holistic View of IQ GROUP with Fundamental Analysis & iVolume Spread Analysis (iVSAChart)
Joe Cool
Publish date: Mon, 05 Sep 2016, 05:51 PM
Background and Core Business
IQ Group Bhd. is a Penang based company founded way back in 1989 and got listed on Bursa Malaysia in 2005 under the Consumer and Fledgling Index. The company is classified under the Electronic Equipment/Instruments Industry.
Their core business is in the ODM and OEM manufacturing of passive infrared sensors and light controllers, passive infrared-controlled security lighting, passive infrared-controlled decorative lighting, general lighting, light emitting diodes lighting, hardwired electromechanical door chimes, wire-free high fidelity door chimes, wire-free lighting and home controls, wireless video door entry products, wireless video communication products, and lighting fixtures. Other business segments include trading of security lighting systems, passive infrared detectors, and motion sensor light controllers.
In terms of overseas market exposure, IQ Group has sales offices based in the United Kingdom to cater for its UK/EU customer base and also Japan. The group has a representative office based in Taiwan for R&D and technology development and a manufacturing facility in Dongguan, China.
Market capitalisation for IQ Group currently stands at around RM 173 million. They are currently in the 3rd quarter of FY2017 which ends on 31 March 2017. Next quarterly results announcement should be on the month of Nov 2016 for Q2 results.
Financial Brief and Ratios (Historical)
|
IQ Group (5107.KL) |
FY 2016 |
|
Revenue (RM’000) |
190,008 |
|
Net Earnings (RM’000) |
20,856 |
|
Net Profit Margin (%) |
10.98 |
|
EPS (Sen) |
23 |
|
PE Ratio (PER) |
8.26 |
|
Dividend Yield (%) |
5.05 |
|
ROE |
14.52 |
|
Cash Ratio |
1.45 |
|
Current Ratio |
4.37 |
|
Total Debt to Equity Ratio |
N/A |
IQ Group has achieved a turnover of RM190 million in 2016, compared to RM193 million in 2015, which is a slight decrease by 2%. This translates to net earnings of about RM20.856 million.
In terms of its Net Profit Margin, it has maintained a respectable 10% for the past 2 financial years. EPS reflects its net earnings and this has slightly reduced from 24 sen last financial year to 23 sen. PE ratio for IQ Group is considered low compared to its peers.
FY 2016 has seen IQ Group increasing its dividend from 8 sen to 10 sen. From a fundamental perspective, we take this development as a positive one and we hope to see the company reward its shareholders in the years to come.
The management’s efficiency is reflected in its ROE of 14%. On the balance sheet, IQ Group appears solid, as seen in the Current Ratio of 4.37. The company has little to no debts and is positively geared as well.
Over the years, IQ Group has been achieving positive operational cash flow and at the same time increased its cash reserves. As reported in FY2016, there was a bucking in this trend of positive operational cash flow by about 35%. Having said that, the company is still able to maintain overall positive free cash flow. In terms of cash flow used for investing activities, 2016 has also seen IQ Group using up to RM7 million for capital expenditure, its highest since 2013.
iVolume Spread Analysis (iVSA) & comments based on iVSAChart software – IQ Group

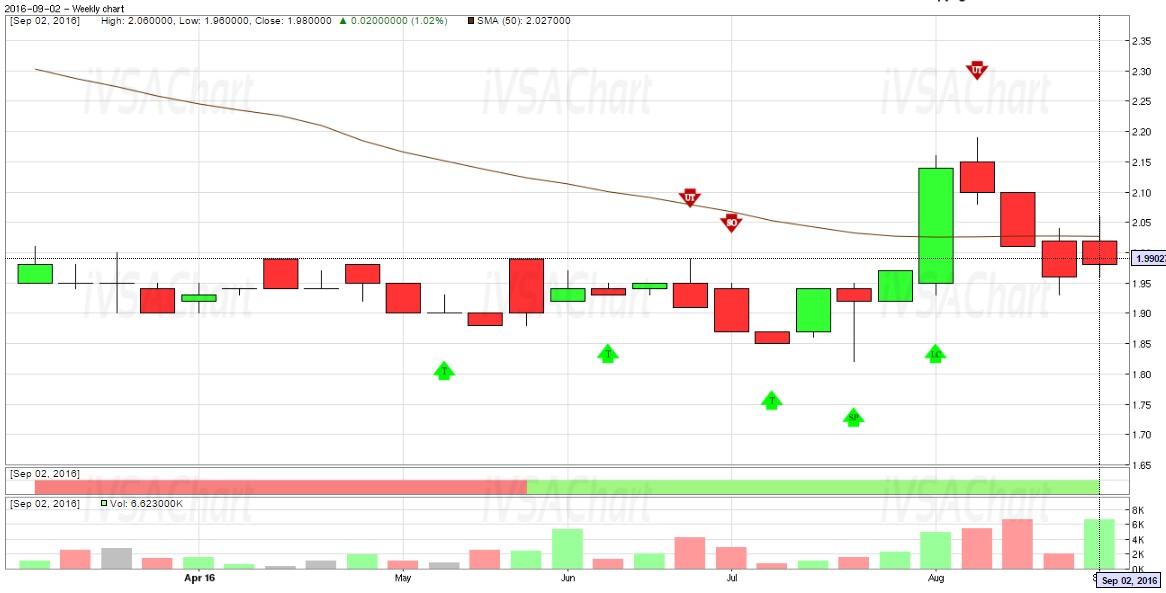
Based on the 6-month weekly iVSAChart for IQ Group, this stock was trading in a trend channel between RM1.85 and RM1.99 when the Sign Of Strength (green arrow) indicators began appearing in May, June and July 2016. These Sign Of Strengths indicate hidden buying by smart money and finally, the stock broke out of this trading range in August 2016, which coincided with the release of its FY2017 results for Q1.
However, this rally was short lived as supply was uncovered around RM2.15 price level as confirmed by the Sign Of Weakness (red arrow) indicator appearing. The price subsequently retreated to its previous trend channel.
It is interesting to note that volume shrunk drastically during prices pull back on the last week of August, suggesting drying up of supply there. A low risk entry to buy this stock can be considered if more Signs Of Strength (green arrows) is detected from this pivot low onwards.
Interested to learn more?
- Free eBook available now! Click this URL to get your free eBook of “Get Rich with Dividends by Bill Wermine and Martin Wong”:
- Find out more about iVSAChart events via: https://www.ivsachart.com/events.php
- Follow & Like us on Facebook via: https://www.facebook.com/priceandvolumeinklse/
- Contact us via: email at sales@ivsachart.com or Call/WhatsApp at +6011 2125 8389/ +6018 286 9809/ +6019 645 3376
This article only serves as reference information and does not constitute a buy or sell call. Conduct your own research and assessment before deciding to buy or sell any stock. If you decide to buy or sell any stock, you are responsible for your own decision and associated risks.
Related Stocks
| Chart | Stock Name | Last | Change | Volume |
|---|
Market Buzz
More articles on iVSA Stock Review
Created by Joe Cool | Dec 15, 2016
Created by Joe Cool | Dec 15, 2016
Created by Joe Cool | Dec 01, 2016
Created by Joe Cool | Dec 01, 2016
Created by Joe Cool | Nov 14, 2016
Created by Joe Cool | Nov 03, 2016
Created by Joe Cool | Oct 24, 2016
Created by Joe Cool | Oct 24, 2016
Created by Joe Cool | Oct 17, 2016


