


iVSA Stock Review
Holistic View of Vitrox with Fundamental Analysis & iVolume Spread Analysis (iVSAChart)

Background and Core Business
Vitrox Corporation Bhd. (Vitrox) started operations in 2000 as a private company, which designs and manufactures automated vision inspection equipment and system-on-chip embedded electronics devices for the semiconductor and electronics packaging industries. In June 2004, Vitrox was listed on Bursa Malaysia under the Technology index and is categorised in the Electronic Production Equipment industry. Market capitalisation of Vitrox is estimated at approximately RM 880 million.
Vitrox’s core business involves Machine Vision Systems, Automated Board Inspection and Electronic Communication Systems. Their main clients are manufacturers from the semiconductor, printed circuit boards companies, Original Equipment Manufacturers (OEM), Original Design Manufacturers (ODM), Electronics Manufacturing Services (EMS) providers and Contract Manufacturers (CM) around the world i.e. Singapore, Indonesia, Thailand, Vietnam, Philippines, Taiwan, China, Japan, Korea, India, Australia, Europe, Brazil, Mexico and USA.
The financial year for Vitrox ends on 31/12/2016, and they are currently operating in their last quarter. Next quarterly results announcement should be on the month of Nov 2016 for Q3 results.
Financial Brief and Ratios
|
Vitrox (0097.KL) |
TTM FY 2016 |
|
Revenue (RM’000) |
200,786 |
|
Net Earnings (RM’000) |
55,070 |
|
Net Profit Margin (%) |
27 |
|
EPS (sen) |
23.51 |
|
PE Ratio (PER) |
15.99 |
|
Dividend Yield (%) |
1.33 |
|
ROE |
23.70 |
|
Cash Ratio |
1.187 |
|
Current Ratio |
4.051 |
|
Total Debt to Equity Ratio |
0.083 |
Based on past 5 years’ figures, Vitrox achieved its highest turnover during 2014 with a revenue of nearly RM170 million. This was followed by a slightly lower figure in 2015 when revenue contracted by 5% to around RM160 million. Net earnings mirrored the revenue trend and contracted by 9% y-o-y between 2014 and 2015 from RM 49 million to RM 44 million. Nevertheless, Vitrox has managed to keep net profit margins high on an average of 25% these past 5 years. Earnings per share based on Training Twelve Months (TTM) figures stand at 23 sen.
In terms of its valuation, Vitrox is not considered expensive at a PE ratio of around 16. Vitrox has been rewarding its shareholders with dividend payments all these years, and we are beginning to see a steadily increasing dividend trend from 2013. However, due to recent price changes, the yield stands at around 1% only. Meanwhile, the management is deemed to quite efficient, as reflected in its ROE of 23.70.
Vitrox also maintains a relatively healthy balance sheet with positive liquidity ratios as seen in their Cash and Current Ratios. They have also managed to increase their cash and cash equivalents. Based on TTM figures, Vitrox has expended about RM 13 million for capital expenditure, the highest since the past 5 years.
iVolume Spread Analysis (iVSA) & comments based on iVSAChart software – Vitrox
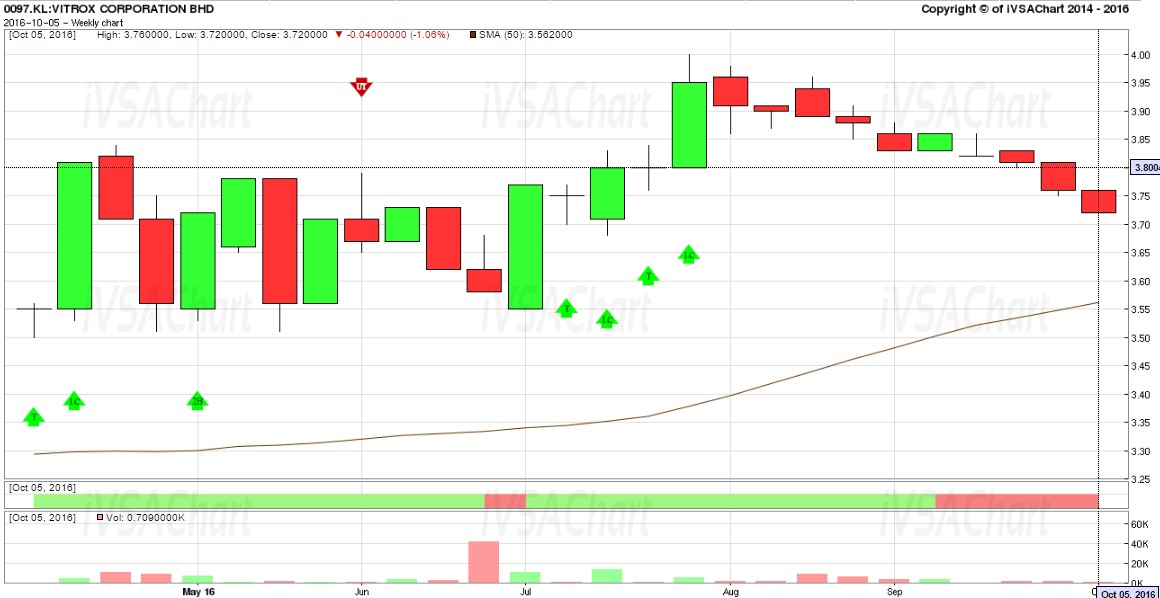
Based on Vitrox 6-month weekly iVSAChart, it is observed that prices started to rally in mid-April 2016 following the appearance of Signs Of Strength (green arrows) on the first 2 weeks of April 2016. Since then, Vitrox is traded in a trend channel between RM 3.50 and RM 3.80 from mid-April to early July 2016.
The appearance of Signs of Strength (green arrows) in July, coupled with higher lows signaled that smart money is supporting the stock. This was followed by rally up to the all-time high of RM 4.00. Profit taking soon took place after reaching the all-time high, with its stock prices retracing to around RM3.72 level under relatively light volume.
In short term, we are seeing weakness and investors with longer term horizon/view are advised to wait for Sign Of Strength (green arrows) to be detected before accumulating this stock.
Interested to learn more?
- Free eBook available now! Click this URL to get your free eBook of “Get Rich with Dividends by Bill Wermine and Martin Wong”: http://ebook.ivsachart.com/
- Find out more about iVSAChart events via: https://www.ivsachart.com/events.php
- Follow & Like us on Facebook via: https://www.facebook.com/priceandvolumeinklse/
- Contact us via: email at sales@ivsachart.com or Call/WhatsApp at +6011 2125 8389/ +6018 286 9809/ +6019 645 3376
This article only serves as reference information and does not constitute a buy or sell call. Conduct your own research and assessment before deciding to buy or sell any stock. If you decide to buy or sell any stock, you are responsible for your own decision and associated risks.
Related Stocks
| Chart | Stock Name | Last | Change | Volume |
|---|
More articles on iVSA Stock Review
Holistic View of Leon Huat with Fundamental Analysis & iVolume Spread Analysis (iVSAChart)
Created by Joe Cool | Dec 15, 2016
Holistic View of Tomypak with Fundamental Analysis & iVolume Spread Analysis (iVSAChart)
Created by Joe Cool | Dec 15, 2016
Holistic View of ECS IT with Fundamental Analysis & iVolume Spread Analysis (iVSAChart)
Created by Joe Cool | Dec 01, 2016
Holistic View of Magni-Tech with Fundamental Analysis & iVolume Spread Analysis (iVSAChart)
Created by Joe Cool | Dec 01, 2016
Holistic View of Teo Seng with Fundamental Analysis & iVolume Spread Analysis (iVSAChart)
Created by Joe Cool | Nov 14, 2016
Holistic View of QL Resources with Fundamental Analysis & iVolume Spread Analysis (iVSAChart)
Created by Joe Cool | Nov 03, 2016
Holistic View of Top Glove with Fundamental Analysis & iVolume Spread Analysis (iVSAChart)
Created by Joe Cool | Oct 24, 2016
Holistic View of Scientex with Fundamental Analysis & iVolume Spread Analysis (iVSAChart)
Created by Joe Cool | Oct 24, 2016
Holistic View of KESM with Fundamental Analysis & iVolume Spread Analysis (iVSAChart)
Created by Joe Cool | Oct 17, 2016
Discussions
Be the first to like this. Showing 0 of 0 comments
Post a Comment
Featured Posts


Latest Videos

MQ Trading Signals
Time
Signal
Duration
Type
2024-07-17 09:00:00
EMA 5
Hourly
SELL
2024-07-17 09:00:00
ADX
Hourly
SELL
2024-07-17 09:00:00
TURTLE SYSTEM 20
Hourly
SELL
2024-07-17 09:00:00
TURTLE SYSTEM 55
Hourly
SELL
Apps


Top Articles
1
南洋行家论股
3
The Alpha Trader
4
BreakingOut
5
Koon Yew Yin's Blog
6
Bursa Stock Musings - Thoughts & Ideas
PGF Capital - insti shareholding up from 5% to 14%! (part 1)
7
BFM Podcast
8
How to become a resilient trader
#
Stock
Score
Daily Stocks
Stock Name
Last
Change
Volume
Stock Name
Last
Change
Volume
Stock Name
Last
Change
Volume
Featured Advertisers / Partners


Ride The Bull Short The Bear
CS Tan
4.9 / 5.0
This book is the result of the author's many years of experience and observation throughout his 26 years in the stockbroking industry. It was written for general public to learn to invest based on facts and not on fantasies or hearsay....