


Initial Public Offering (IPO)
IPO - Elridge Energy Holdings Bhd (Part 2)

MQTrader Jesse
Publish date: Fri, 09 Aug 2024, 12:06 PM
Financial Highlights
The key financial highlights based on the historical audited combined financial statements of the Group for the Financial Years/Period Under Review are as follows:
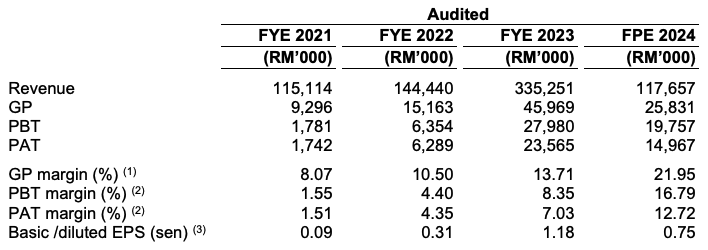
The revenue increased from RM 115 million in FYE 2021 to RM 335 million in FYE 2023 and grew by approximately 34.04% to RM117.66 million for FPE 2024 (FPE 2023: RM87.78 million). Its growth is due to their strategy to continue focusing on fulfilling the purchase orders of PKS received from their foreign customers in Singapore, Japan and Indonesia.
The gross profit margin increased from 8.07% in FYE 2021 to 13.71% in FYE 2023 and grew by approximately 99.73% to 21.95% for FPE 2024 (FPE 2023: 10.99%). The improvement in GP margin is attributed to the decrease in the average purchase price of unprocessed PKS.
The PAT margin grew from 1.51% in FYE 2021 to 7.03% in FYE 2023.
The gearing ratio is 0.55, which is above the benchmark. (A good gearing ratio should be between 0.25 – 0.5). However, it is expected to decrease to 0.19 times (after the Public Issue and utilisation of proceeds) mainly due to the increase in shareholders’ funds arising from the issuance of new Shares pursuant to the Public Issue.
Major customers and suppliers
For the Financial Years/Period Under Review, the Group’s top five (5) major customers collectively contributed 79.69%, 48.80%, 85.08% and 93.18% to the Group’s total revenue, respectively. The Group is dependent on Cleantop Biomass Sdn Bhd, Green Bio World Sdn Bhd and PT. Apac Metal Indonesia, Z & Z SG Pte Ltd and Deus Ex Capital Pte Ltd by virtue of their revenue contributions of more than 20% of the Group’s total revenue during the respective FYEs and in FPE 2024. Notwithstanding the above, there is no concern on concentration risk associated with any of the Group’s major customers as the revenue contribution from the top five (5) major customers are broadly spread among various major customers on a yearly basis.
Major Suppliers
For the Financial Years/Period Under Review, the Group purchased 75.75%, 69.83%, 56.24% and 70.44% of the Group’s total purchases from the top five (5) major suppliers, respectively. The Group is dependent on Biotechnology Sensational Sdn Bhd by virtue of their contribution of more than 20% of the Group’s total purchases during the respective FYEs (Please refer to Section 7.22.3 of this Prospectus for further details on the supply contract with Biotechnology Sensational Sdn Bhd). Notwithstanding the above, there is no concern on concentration risk associated with any of the Group’s major suppliers as the purchases from the top five (5) major suppliers are broadly spread among the major suppliers in the year. Evidently, their purchases from Biotechnology Sensational Sdn Bhd, which amounted to approximately 25.77% in FYE 2021, decreased to 11.83% in FYE 2023 and increased to 21.21% in FPE 2024. Further, in line with the Group’s expansion plan to set up new factories in Johor, Pahang and Sabah, they expect to be able to expand their network of suppliers to include suppliers based in these states. Consequently, this would enable us to reduce any dependency on the abovementioned major suppliers.
Industry Overview
According to Providence's research, The industry size for palm kernel shells in Asia Pacific, in terms of sales of palm kernel shells in the region, grew from USD218.6 million (RM905.6 million1) in 2019 to USD283.3 million (RM1.3 billion1) in 2023 at a compound annual growth rate (“CAGR”) of 6.7%. Meanwhile, the wood pellet industry size in Asia Pacific, in terms of sales of wood pellets, grew from USD7.5 billion (RM31.1 billion1) in 2019 to USD9.8 billion (RM44.7 billion1) in 2023 at a CAGR of 6.9%. Moving forward, the palm kernel shells industry size in Asia Pacific is forecast to grow at a CAGR of 8.9% from an estimated USD308.6 million (RM1.4 billion1) in 2024 to USD366.1 million (RM1.7 billion1) in 2026, while the industry size for wood pellets in Asia Pacific is forecast to grow by a further CAGR of 8.6%, from USD10.6 billion (RM48.4 billion1) in 2024 to USD12.5 billion (RM57.1 billion1) in 2026.
Key Growth Drivers
Growing exports to international markets
Growing demand for biomass fuel products from end-user industries in Malaysia
Availability of raw materials for manufacturing biomass fuel products in Malaysia
Industry Risks and Challenges
Competition from other industry players
Product substitution risks
Future plans and strategies for ELRIDGE ENERGY HOLDINGS BERHAD
Their business objectives are to maintain sustainable growth in their business and create long term shareholder value. The future plans and business strategies of the Group are as follows:
The company intends to expand their production capacity for PKS in order to grow their sales by setting new factories in Pasir Gudang (Johor), Kuantan (Pahang) and Lahad Datu (Sabah).
MQ Trader View
Opportunities
The company has demonstrated their ability to comply to requirements set by local and foreign customers
Port Klang Factory is strategically located and is equipped to produce quality biomass fuel products.
The company’s biomass fuel products can cater for various end-user industries.
Risk
The company may face manufacturing disruptions due to unforeseeable circumstances like natural disasters, fires, floods, disease outbreaks, or power outages.
The company risks product substitution, where a shift in preference to other biomass fuels could lower demand for PKS and wood pellets, adversely impacting their business and financial performance.
The company is exposed to foreign exchange rate fluctuations since their transactions are mainly in RM, SGD, and USD; depreciation of RM against these currencies will increase revenues in RM and vice versa.
Click here to continue the IPO - Elridge Energy Holdings Bhd (Part 1)
Eager to explore more trading opportunities? Apply margin account now!
Community Feedback
We encourage traders to try out and evaluate the MQ Trader system and provide us feedback on the features you like to see in the system. We have received many positive feedbacks so far, and we are currently compiling and reviewing them for possible inclusion into the next release of the system.
We would like to develop this system based on community feedback to cater for community needs. Thanks to all those who have provided valuable feedback to us. Keep those feedback coming in!
Disclaimer
This article does not represent a BUY or SELL recommendation on the stock covered. Traders and Investors are encouraged to do their own analysis on stocks instead of blindly following any Trading calls raised by various parties in the Internet. We may or may not hold position in the stock covered, or initiate new position in the stock within the next 7 days.
Join us now!
MQ Trader stock analysis system uses Artificial Intelligence (AI), various technical indicators and quantitative data to generate accurate trading signals without the interference of human's emotions and bias against any particular stock. It comprises trading strategies which are very popular among fund managers for analysing stocks.
MQ Trader stock analysis system is SPONSORED for MQ Trader members. To use this amazing tool, you can sign up via MQ Trader Sign Up!
Contact us
Please do not hesitate to contact us if you have any enquiry:
Facebook: https://www.facebook.com/mqtrader
Instagram:https://www.instagram.com/mqtrader
MQ Chat: https://messenger.i3investor.com/m/chatmq
YouTube: https://www.youtube.com/channel/UCq-26SGjlQTVQfO7DoEihlg
More articles on Initial Public Offering (IPO)


Discussions
Be the first to like this. Showing 0 of 0 comments
Post a Comment
Featured Posts
Introducing MY's First IPO Fund for Sophisticated Investors!
New Update. Discover investment communities that resonate with your ideas
M & A Value Partners IPO Equity Fund has been launched - Targeted 13% Return p.a
Latest Videos


Apps


Top Articles
1
2
Good Articles to Share
Eli Lilly CEO on Fighting Cancer and Obesity, Drug Pricing (Correct)
3
Good Articles to Share
Evercore ISI's Julian Emanuel says its too early to buy weakness
4
Good Articles to Share
5
Good Articles to Share
6
Good Articles to Share
7
Good Articles to Share
Thousands help at huge Los Angeles wildfire donation center | REUTERS
8
Good Articles to Share
Tens of thousands demonstrate in nationwide strike in Belgium | REUTERS
#
Stock
Score
Daily Stocks
Stock Name
Last
Change
Volume
Stock Name
Last
Change
Volume
Stock Name
Last
Change
Volume
MQ Trading Signals
Stock
Time
Signal
Duration
Stock
Time
Signal
Duration
Featured Advertisers / Partners


Ride The Bull Short The Bear
CS Tan
4.9 / 5.0
This book is the result of the author's many years of experience and observation throughout his 26 years in the stockbroking industry. It was written for general public to learn to invest based on facts and not on fantasies or hearsay....