


MQTrader Education Series
MQ Trader Strategy - MACD and RSI

MQTrader Jesse
Publish date: Tue, 24 Jul 2018, 11:41 AM
What is the Moving Average Convergence Divergence (MACD)?
Moving average convergence divergence (MACD) is a trend-following momentum indicator that shows the relationship between 2 moving averages of prices.
Calculation of MACD
Construction of a MACD is not complicated, as long as you know how to calculate EMA. The following steps can be used to compute MACD:
- Calculate a 12 days EMA of closing prices
- Calculate a 26 days EMA of closing prices
- Deduct the longer EMA in (2) from the shorter EMA in (1)
- Calculate a 9 days EMA of the MACD line obtained in (3)
What is Relative Strength Index (RSI)?
Relative Strength Index (RSI) is a momentum indicator that measures the magnitude of the recent price changes to analyze overbought or oversold conditions. Generally, an RSI reading over 70 indicates an overbought situation; below 30 is an oversold situation.
Calculation of RSI
RSI formula:
RSI = 100 – 100 / (1 +RS)
Where RS = Average gain of up periods during the specified time frame / Average loss of down periods during the specified time frame
Pairing MACD with RSI
RSI and MACD combination is an ideal trading strategy for beginners or traders who prefer a simpler rule based trading strategy. They can complement to each other to avoid false triggers when RSI indicator is used to measure the market momentum while MACD oscillator’s histogram is utilized as a timing indicator.
Trading signals
MQ Trader stock analyzing system assists traders to identify the BUY and SELL signals easily by using Green and Red arrows. The trading signals will appear when all of the following conditions occur.
Buy Signal:
- RSI exceeds 50
- MACD histogram crosses 0-line from below
- Buy on the candle close with stops at the candle’s low
- Hold the position until another reversal signal is observed
Sell signal:
- RSI goes below 50
- MACD histogram crosses the 0-line from above
- Sell on the candle close with stops at the candle’s high
- Hold the position until another reversal signal is observed
MACD and RSI Trading Strategy on Supermax
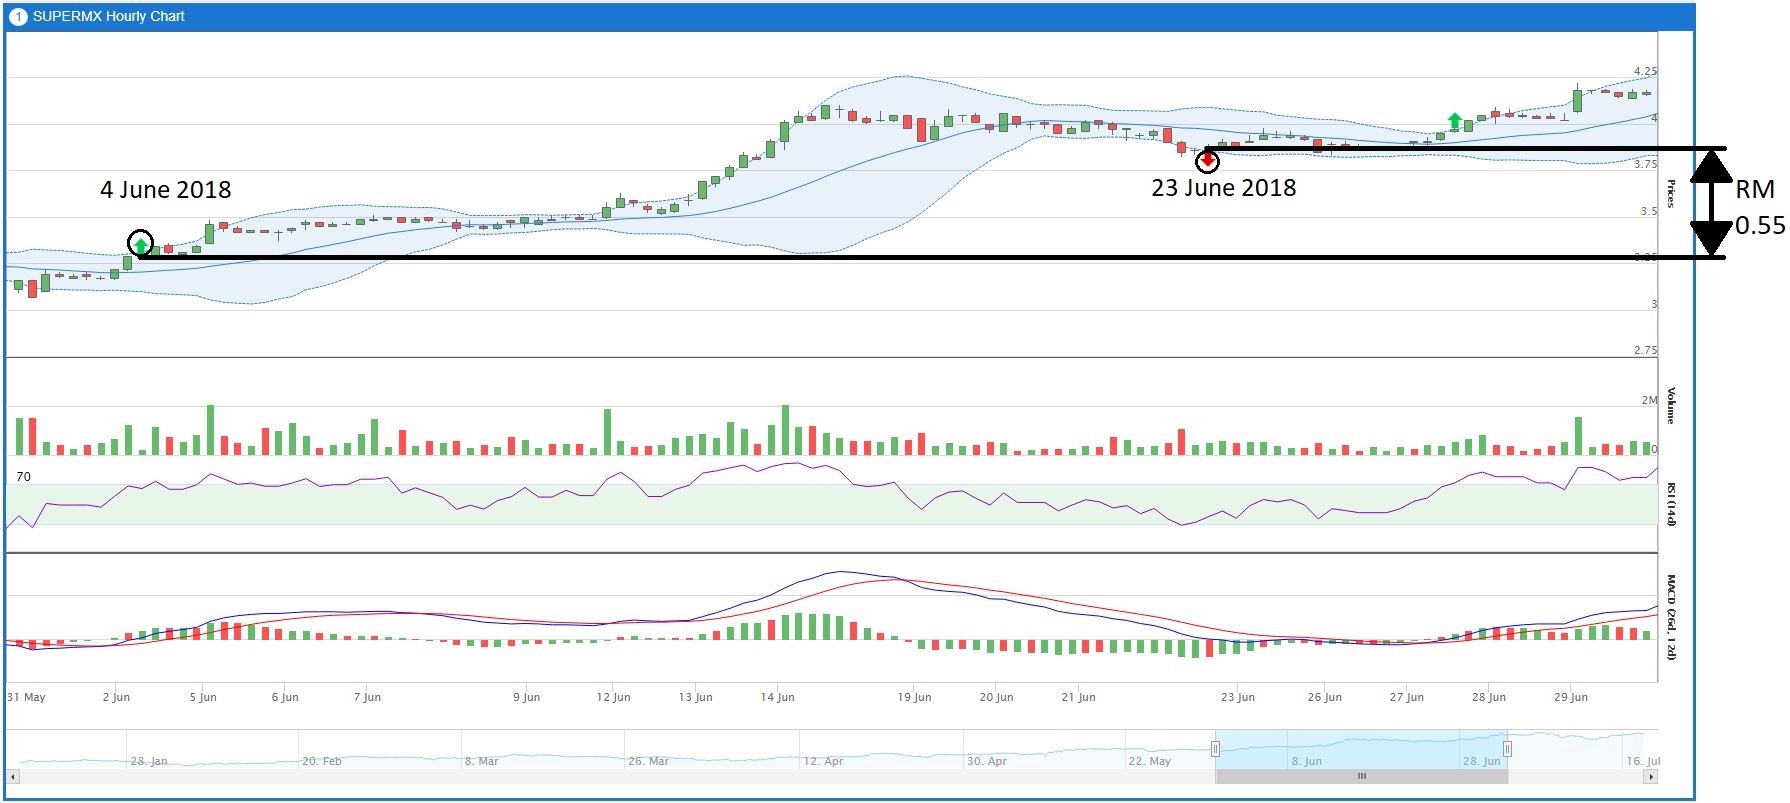
Figure 1: MACD and RSI Hourly Chart where a candle represents share price movement within an hour.
The Entry and Exit from the position can be demonstrated by using MACD & RSI technical charts of Supermax. Figure 1 shows that RM 0.55 per share of profit can be earned when we enter the position on 2 Jun 2018 while exiting the position on 22 Jun 2018. The trading signals appear when the trading signal criteria as mentioned above are met.
Based on the characterisctics of MACD and RSI, it will be less sensitive than EMA 5 Crossover on price movement. Hourly charts of both MACD and RSI and EMA 5 Crossover has been used to compare the sensitivity of trading signals to buying momentum of Supermax shares as shown in Figure 2. There is a buy signal (green arrow) found in Figure 2 (b) showing that strongly bullish trend is required for the generation of buy signals by using MACD and RSI trading strategy.
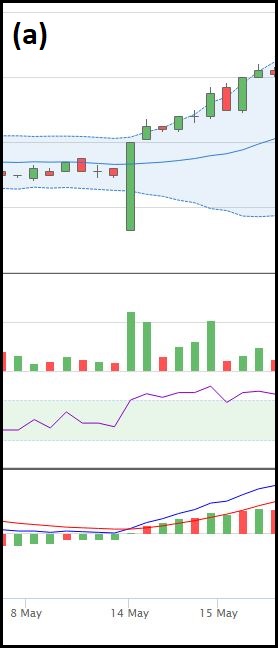
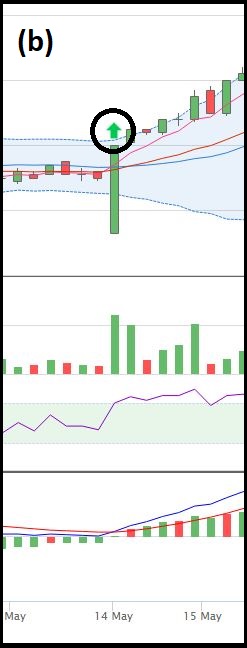
Figure 2: Comparison of trading signals between (a) MACD and RSI and (b) EMA 5 Crossover.
MACD and RSI trading strategy has some limitations under certain situations.
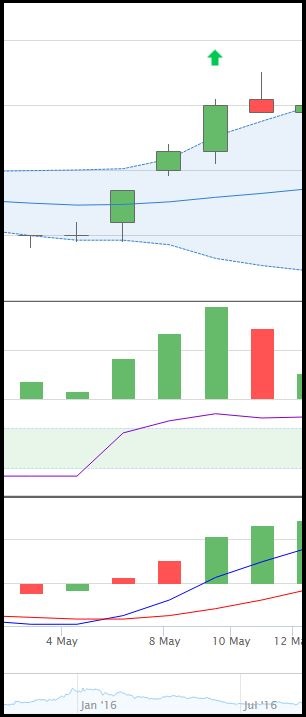
The figure above focuses on the buy signal which appears on 11th May 2018. The buy signal is detected after a strong increase in buying volume is observed. As a result, this trading signal is not sensitive enough to the price movement, as we are unable to seize the buy opportunity before the sharp increase in share price.
The unreliability of the trading signal is caused by the usage of longer time basis of MACD and RSI daily chart leading to lagging effect for trading signals upon analyzing Supermax share price. The lagging effect can be offset by using charts with shorter time basis (i.e. 30 mins, hourly) that is more sensitive to the share price movement.
Conclusion
In short, MACD and RSI Trading Strategy can improve the probability but it is never a sure bet. There might be some failed signals triggered over the time, so this is why different trading strategies (EMA 5 Crossover, ADX Crossover, Guppy MMA, OBV Breakout) have to be used to confirm the trading signals. Every trader has different trading styles, so we can combine different trading strategies to confirm the trading signals before we enter or exit from our position.
Community Feedback
We encourage traders to try out and evaluate the MQ Trader system and provide us feedback on the features you like to see in the system. We have received many positive feedbacks so far, and we are currently compiling and reviewing them for possible inclusion into the next release of the system.
We would like to develop this system based on community feedback to cater for community needs. Thanks to all those who have provided valuable feedback to us. Keep those feedbacks coming in!
Disclaimer
This article does not represent a BUY or SELL recommendation on the stock covered. Traders and Investors are encouraged to do their own analysis on stocks instead of blindly following any Trading calls raised by various parties in the Internet. We may or may not hold position in the stock covered, or initiate new position in the stock within the next 7 days.
Join us now!
MQ Trader stock analysis system uses Artificial Intelligence (AI), various technical indicators and quantitative data to generate accurate trading signals without the interference of human's emotions and bias against any particular stock. It comprises trading strategies which are very popular among fund managers for analysing stocks.
MQ Trader stock analysis system is SPONSORED for MQ Trader members. To use this amazing tool, you can sign up via MQ Trader Sign Up!
Contact us
Please do not hesitate to contact us if you have any enquiry:
Email: service@mqtrader.com
Related Stocks
| Chart | Stock Name | Last | Change | Volume |
|---|
More articles on MQTrader Education Series

Is there a safe haven to invest in a recessionary environment?
Created by MQTrader Jesse | Apr 13, 2023
MQ Trader - Why trade in a stock market that has strong currency?
Created by MQTrader Jesse | Aug 06, 2021
MQ Trader - How to validate buy signals by using MQ Live Backtesting? [ECOWLD]
Created by MQTrader Jesse | Nov 01, 2019
Featured Posts


Apps


Top Articles
1
https://dividendguy67.blogspot.com
2
3
4
6
Good Articles to Share
7
Good Articles to Share
Sydney house fire kills three children, police suspect homicide
8
Good Articles to Share
#
Stock
Score
Daily Stocks
Stock Name
Last
Change
Volume
Stock Name
Last
Change
Volume
Stock Name
Last
Change
Volume
Featured Advertisers / Partners


Ride The Bull Short The Bear
CS Tan
4.9 / 5.0
This book is the result of the author's many years of experience and observation throughout his 26 years in the stockbroking industry. It was written for general public to learn to invest based on facts and not on fantasies or hearsay....