


Radzi's Articles
Airasia X (AAX - 5238) Revenue Prediction for Year 2017 Via Time Series Analysis

Well folks, here I go again with my analysis. In my previous post, I have talked about cost and forex gain/loss dependencies on exchange rate by using simple linear regression. Today, I am writing about AAX revenue prediction.
It involves some steps because , AAX revenue is typically cyclical, as shown in the graph below.
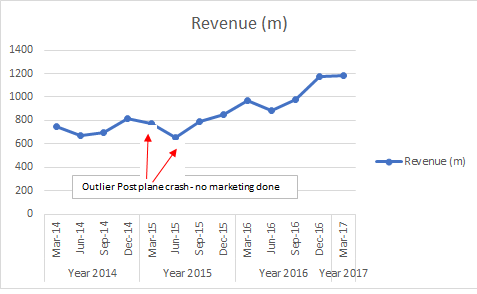
We have outliers in the revenue data shown by the two red arrows ie for revenue in March 2015 and Jun 2015. The outliers are caused by the effect of Airasia plane crash in December 2014. (Airasia did not do any advertisement and marketing effort 6 months after the crash out of respect to the crash victims). The outliers will affect some prediction accuracy, but we cannot make do without them as we need as much data as we could for this analysis.
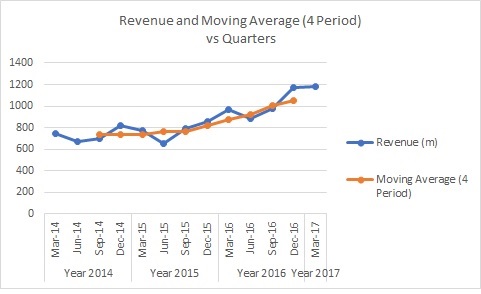
For all you may have known, time series analysis information contains three components - (1) the cyclical (or seasonal) component, (2) the irregular component (outlier) and (3) the trend component.
In order to separate those components and eliminate the irregular component , we would calculate the moving average of the data, shown by the brown 'line in the graph below. Since the cycle is repeated over 4 periods, the data is averaged over 4 periods, simply denoted by MA(4).
I would not want to go into details of the steps that was taken and done. Enough for me to say that once we have removed the seasonal and irregular component, we are left with trend component and we apply simple linear regression to get the formula of the trend component.
Again, I have to caress my crystal ball, and it gives the following result.
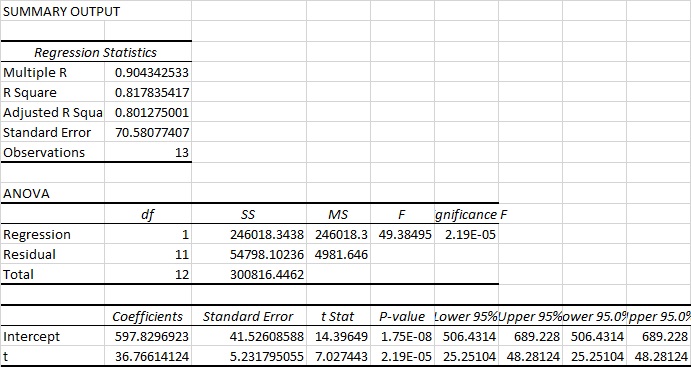
My crystal ball says one thing for sure, that are, 80% of the movement of the trend component can be explained by the time factor, and we have over 99% confident that the trend and intercept move linearly.
Mathematical, the revenue trend component is given by the following formula.
Revenue Trend = 36 (Continuous Time Period) + 597 ............... Formula 3.
Time series analysis does not stop at linear revenue trend because the revenue trend is seasonal or cyclical. So, we re-incorporate back the seasonal component, by applying the following formula :
Seasonal Revenue = Seasonal Component x Revenue Trend ........... Formula 4.
Once we got that formula, we forecast (predict) future revenue from June 2017 onwards. The prediction is shown by the graph below:
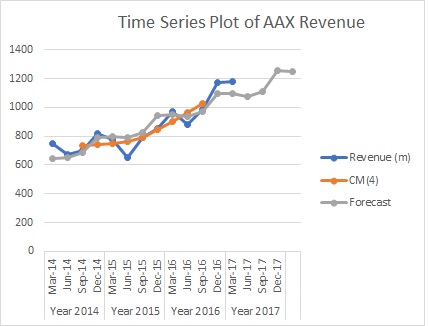
The prediction of AAX revenue is shown by the grey line. For sharing purpose, let me publish the data here.
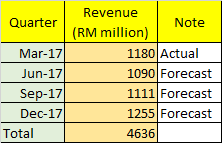
Comparatively, revenue of AAX in 2016 is RM 4.05 billion and revenue in 2015 is RM 3.074 billion.
So, the time series revenue prediction model, forecast a 15% increase of revenue in 2017 compared to 2016. It is an awesome increase considering AAX does not add new plane this year. Only by increasing efficiencies of existing plane and put into action idle planes, 15% of additional revenue is obtained. That is amazing !
*** Note that , the formula forecast June 2017 revenue as RM 1.09 billion. In truth, we may get hgher revenue in the remaining quarters, as new route are introduced from Indonesia - Bali-Narita and the introduction of KL/Japan - Hawaii route in 2H 2017. All looks good for AAX !
I do hope you would enjoy this analysis, and as you wish, you may give any suggestions that may improve this analysis.
Related Stocks
| Chart | Stock Name | Last | Change | Volume |
|---|
More articles on Radzi's Articles
Competitive Market of Airport Operators Would Bring Values to Tourism Industry & Country
Created by radzi | Aug 22, 2017
AirAsiaX - CNBC - "Air Asia's Long Haul Flights to Hawaii Will be a Key Profit Driver for The Group"
Created by radzi | Aug 01, 2017
Prediction of AAX Profit Before Tax for Q2 2017 (Result release August 2017) - An Analytic Model.
Created by radzi | Jun 12, 2017
AirAsiaX (AAX - 5238) Dependency on the movement of US Dollar. Part 2 - Fuel Expenses.
Created by radzi | Jun 06, 2017
AirAsiaX (AAX - 5238) Dependency on the movement of US Dollar. Part 1 - Forex Gain/Forex Loss.
Created by radzi | Jun 05, 2017
Discussions
Be the first to like this. Showing 5 of 5 comments
Hahahahaha acceso, I can see that you cannot write a better "rubbish" than that article.
2017-06-08 13:04
Post a Comment
Featured Posts
Introducing MY's First IPO Fund for Sophisticated Investors!
New Update. Discover investment communities that resonate with your ideas
M & A Value Partners IPO Equity Fund has been launched - Targeted 13% Return p.a
Latest Videos


MQ Trading Signals
Time
Signal
Duration
Type
2024-07-17 11:35:00
ADX
5 Mins
SELL
2024-07-17 11:10:00
EMA 5
5 Mins
SELL
2024-07-17 11:00:00
TURTLE SYSTEM 20
Hourly
SELL
2024-07-17 10:00:00
TURTLE SYSTEM 20
10 Mins
SELL
2024-07-17 10:00:00
TURTLE SYSTEM 55
10 Mins
SELL
Apps


Top Articles
1
南洋行家论股
3
The Alpha Trader
4
BreakingOut
5
Koon Yew Yin's Blog
6
Bursa Stock Musings - Thoughts & Ideas
PGF Capital - insti shareholding up from 5% to 14%! (part 1)
7
How to become a resilient trader
8
RHB Investment Research Reports
#
Stock
Score
Daily Stocks
Stock Name
Last
Change
Volume
Stock Name
Last
Change
Volume
Stock Name
Last
Change
Volume
Featured Advertisers / Partners


Ride The Bull Short The Bear
CS Tan
4.9 / 5.0
This book is the result of the author's many years of experience and observation throughout his 26 years in the stockbroking industry. It was written for general public to learn to invest based on facts and not on fantasies or hearsay....
John Lu
Beli jangan tak beli...43c sapu berlori-lori
2017-06-06 23:04