


https://dividendguy67.blogspot.com
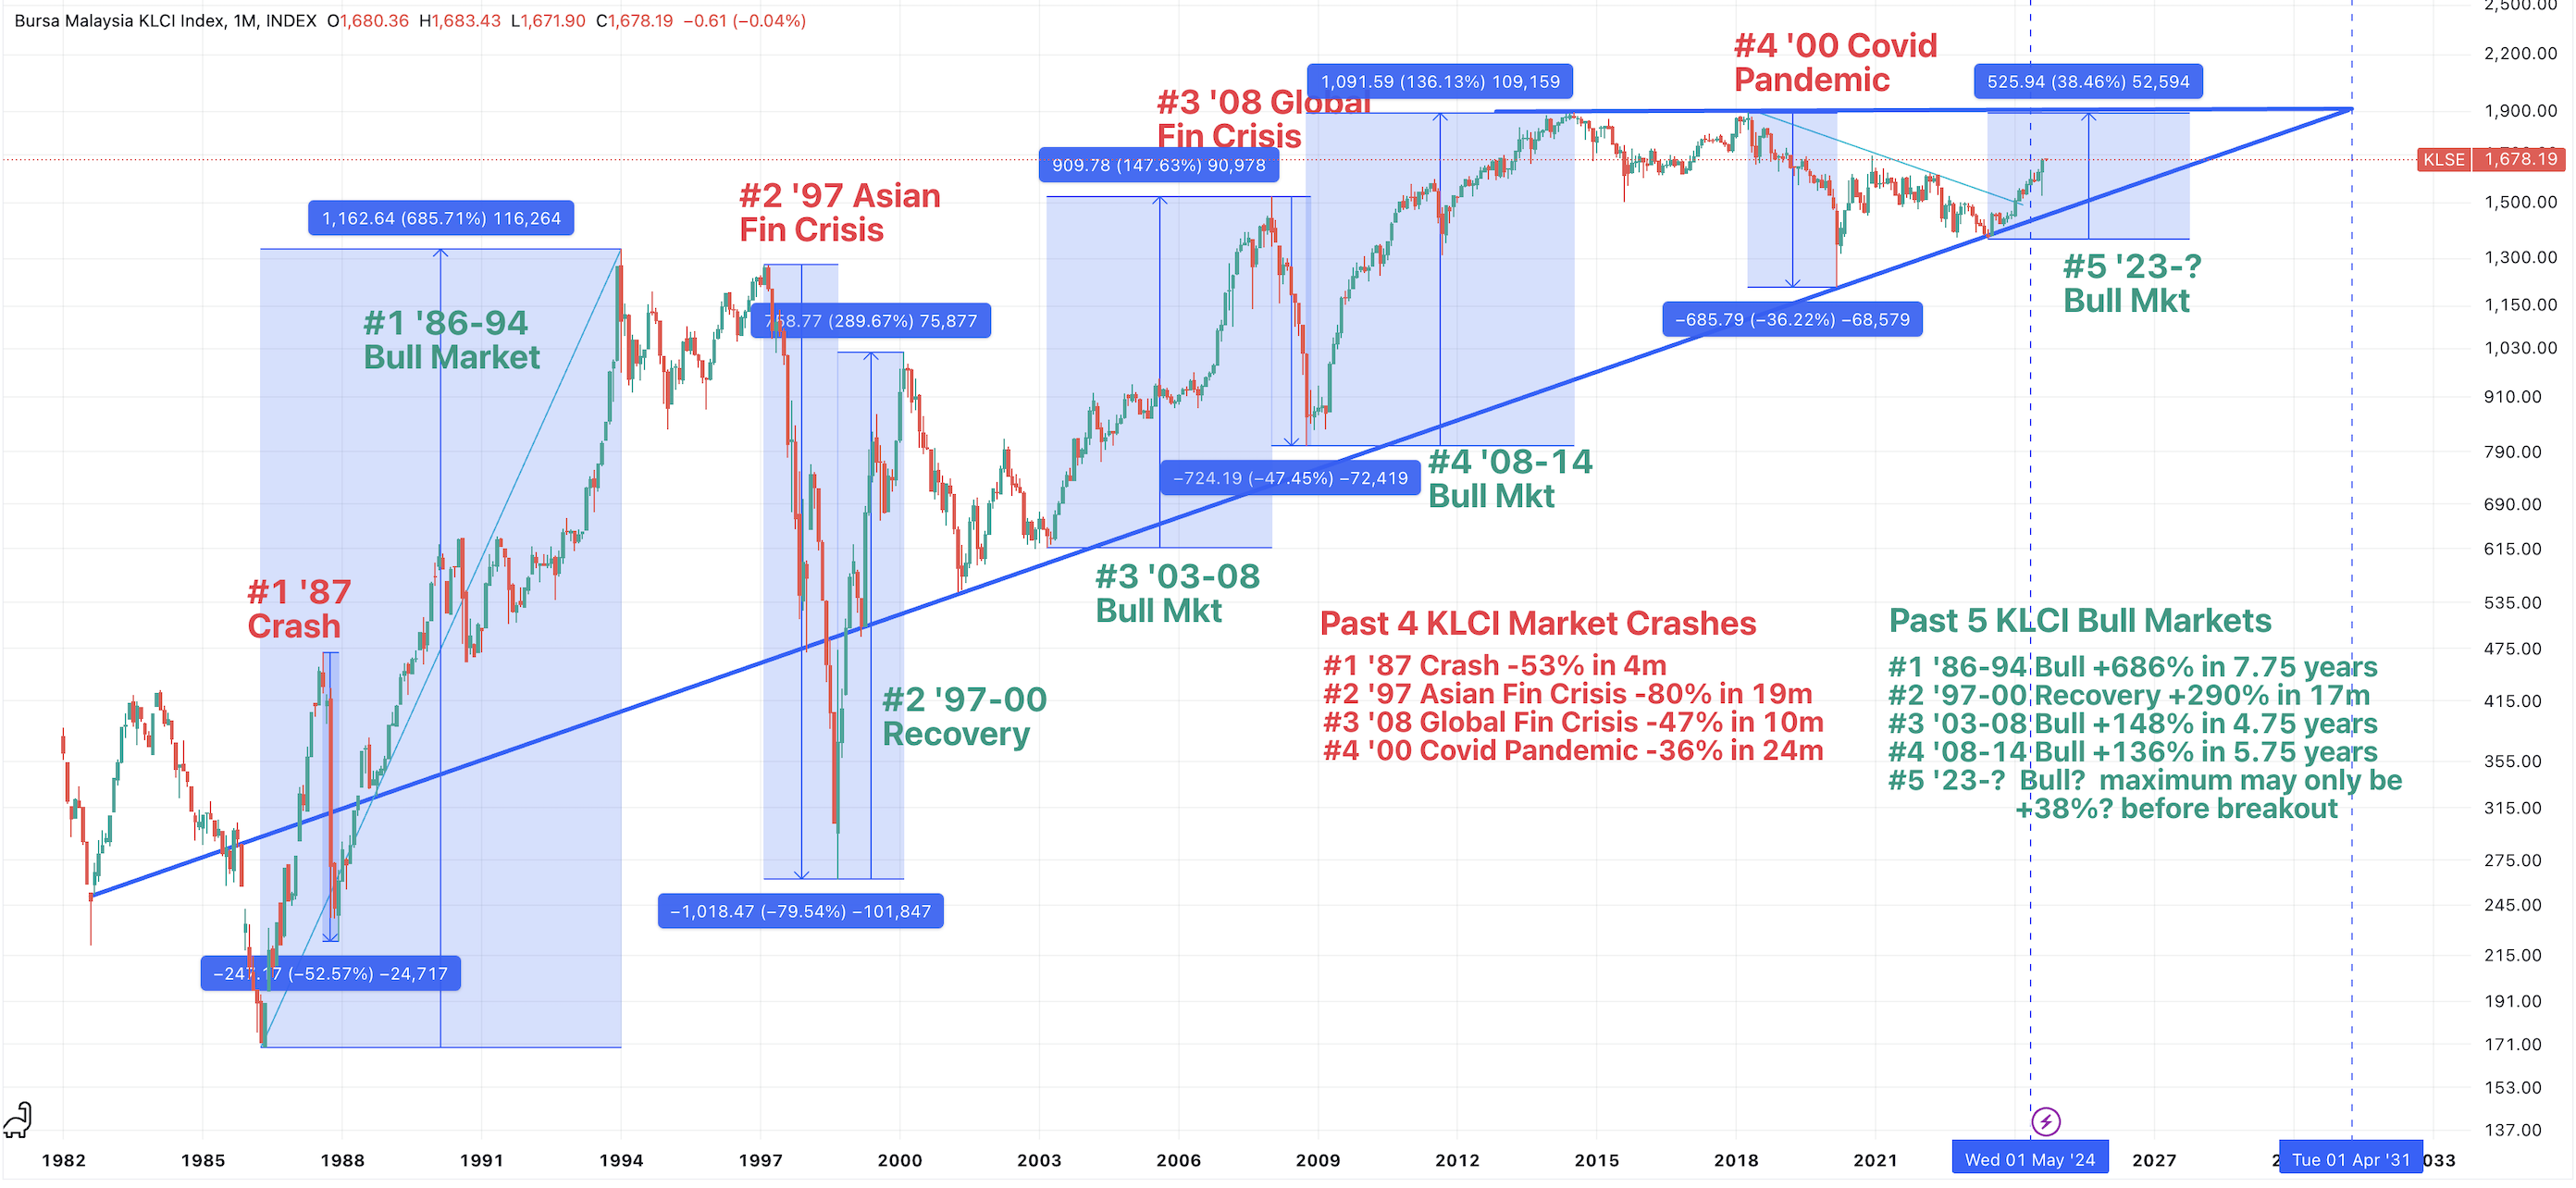
KLCI - Bull and Bear Markets the past 4 decades

Background
It was a great brief chat and sharing from a veteran trader here who is currently having a blast of a time in the Japanese stock market, where the Nikkei broke new highs after 34 years! Similarities to KLCI back in Jan 94 was alluded to. Prompted me to pull up the KLCI chart to see how our backyard has performed the past 4 decades. I had many interesting insights. Sharing here with you my quick take-aways.
The past 4 decades
They say one chart speaks a thousand words ...
Key observations about Bear Markets / Crashes
- Market crashes / Bear Markets don't last very long
- The shortest was the '87 Crash that lasted only 4 months.
- The longest was the most recent Covid Pandemic that lasted 2 years.
- The crash size was scary and real world bears are nothing like textbook's -20% decline.
- The worst was Asian Financial Crisis of '97 and crashed 80%!!!
- The '87 Crash was super scary - dropping 53% in just 4 months!
- The '08 GFC was also scary - dropping 47% in 10 months!
- The most recent '00 Covid Pandemic was the mildest amongst the 4, dropping 36% over 24 months.
- Will the next "bear market / market crash" be smaller in quantum and longer in time?
- Personally, I don't think we'll see these 3 again in my lifetime - the Asian Financial Crisis, the Global Financial Crisis and the '08 Stock Market Crash.
- I suspect the next one will be smaller in quantum (and potentially longer in time too).
Key observations about Bull Markets
- Bull Markets lasted over a much longer time.
- The '86-94 lasted nearly 7.75 years and was the biggest move up gaining nearly 700%!
- It's hard to imagine how big is +700% but if you started investing when KLCI was 1,400, by the time this bull finishes its run, you'll see the equivalent move in KLCI to hit 10,000!!!
- That is how crazy the old times was in '86-94!
- The next '97-00 Recovery recovered extremely fast, making +290% in less than 1.5 years!
- Again, it's so hard to imagine, but if KLCI was 1,400 and the same move happened in 1.5 years, the KLCI would have been like 4,100!!!
- The next is '03-08 Bull Market making +148% in 4.75 years!
- The next is '08-14 Bull Market making +136% in 5.75 years.
- Each successive quantum unfortunately is smaller.
- That's probably because we may be approaching the end of the triangle where the points might meet in 2031 (say 2030-2032)
- Based on the KLCI low in 2023, it appears there's only a maximum upside quantum of +38% before hitting horizontal resistance, which is too small, relative to past bulls over past 4 decades.
- Hence, I am optimistic, we will eventually break through that horizontal resistance since 2013, over a decade already!
- There is the TA rule that says that the longer the resistance, when the break out happens, it will be fireworks and spectacular!
- A resistance longer than 10 years certainly qualifies for that!
- If that were to happen, then, the KLCI can regain it's past glory! Hope to see KLCI going past the glorious 3000 magical level, but this could take many, many more years to come! Haha! (we can dream)
Summary and Conclusion
I hope you found the chart interesting and insightful as I did!
It was hard to imagine the "old days" when KLCI was smaller and more volatile.
- What surprised me was how big the volatility was.
- Now the stories my late Dad told me may years ago made sense.
- There were lots of monies to be made then - so much so that I can now finally understood how my Dad, a civil servant, was able to make stock market gains to fund my younger siblings overseas tertiary education from the '86-94 bull market!
The other takeaway was the observations that subsequent bull market gains appeared to be shrinking in size. Hope this is just temporary.
On the flip side, bear markets are nothing like text book's -20% price falls.
- The 3 big crashes are the '87 stock market crash (very fast 4 months, very big 53% crash), the '97 Asian Financial Crisis (that is unlikely to be repeated in my lifetime), the '07 Global Financial Crisis (that I think is also unlikely to be repeated in my lifetime).
- The Covid pandemic was less scary (-36%) and took a longer time (24 months).
- Whilst we don't know when or how big the next crash will be, I feel, for now, it may be less worse than Covid, as there are still no excesses in the Malaysian stock market but lots of under-valuations. E.g. we still have solid banks trading at single digit P/E which is ridiculous!
Let's hope our economy and our stock market will eventually overcome this temporary period, and one day makes the necessary breakout to the upside to deliver KLCI to at least +100% returns or near 3,000!!
- It won't be soon of course.
- It may take many more years, but who knows!
We dare to dream :-).
All the best!
Disclaimer: As usual, you are solely responsible for your own trading and investing decisions.
More articles on https://dividendguy67.blogspot.com
Discussions
Be the first to like this. Showing 0 of 0 comments
Post a Comment
Featured Posts
Introducing MY's First IPO Fund for Sophisticated Investors!
New Update. Discover investment communities that resonate with your ideas
M & A Value Partners IPO Equity Fund has been launched - Targeted 13% Return p.a
Latest Videos


Apps


Top Articles
2
save malaysia!
3
4
Kenanga Research & Investment
5
Axcapital's investment blog
6
AmInvest Research Reports
7
Koon Yew Yin's Blog
8
TA Sector Research
2QCY24 Results Review - Delivers Second Straight Quarter of Growth
#
Stock
Score
Daily Stocks
Stock Name
Last
Change
Volume
Stock Name
Last
Change
Volume
Stock Name
Last
Change
Volume
MQ Trading Signals
Stock
Time
Signal
Duration
Stock
Time
Signal
Duration
Featured Advertisers / Partners


Ride The Bull Short The Bear
CS Tan
4.9 / 5.0
This book is the result of the author's many years of experience and observation throughout his 26 years in the stockbroking industry. It was written for general public to learn to invest based on facts and not on fantasies or hearsay....