KLSE Stocks Review
Luster 5068
ChartStory72
Publish date: Mon, 12 Apr 2021, 12:37 PM

2nd April's Analysis
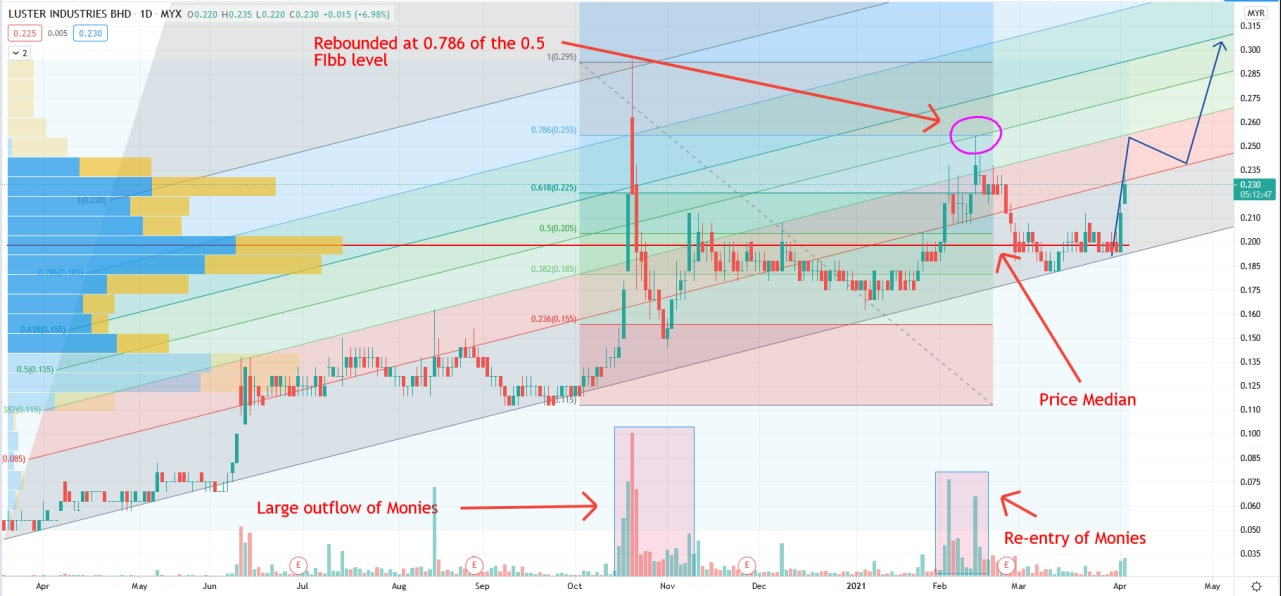
Not going to lie, the Huge Selloff during the November period last year really does look like a typical Pump and Dump stock, until recently during February. I detect a large inflow of Monies which caused prices to start going up again. Which continues the uptrend.
By using Fibb Trend + Retracement we can see that prices rebounded EXACTLY at the 0.786 + 0.5 Fibb level. And with that knowledge we can predict future movements which shown above as the blue line. Where prices should rally to the next Fibb level, which is 0.786 of the 0.382 level.
Industry : Industrial Products & Services.

Today 12th April
*Updated*
One of the Top Most Actively Traded Counter.
I had previously analyze thie stock before and provide a quick update on it.
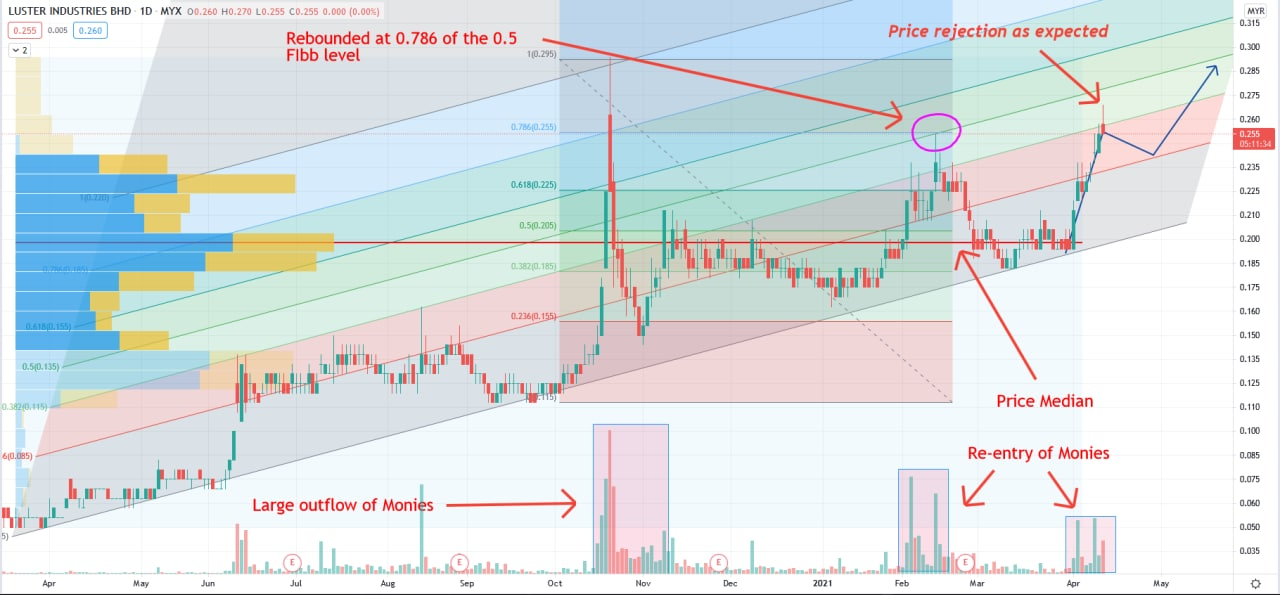
We see a price rejection from the 0.382 + 0.786 Fibb level which i successfully predicted in my previous analysis.
Prices should retrace alittle back to the 0.236 level before heading higher towards the 0.5 Fibb level.
Industry : Industrial Products & Services.
In this fast-moving digital world, we get information in a few clicks.
However, we rarely get first-hand information and more often we get misleading news.
Investing in stocks today is very different from the past, but one thing hasn't changed - to study about a stock before putting money in.
A stock chart contains data that is publicly available and accurate by itself. By having certainty in data quality, we can comfortably study charts and make investment judgements.
At Chart Story, we believe stock prices move for a reason. Our objective is to share what we believe.
More articles on KLSE Stocks Review
YTL (0025) The Story behind the Chart of YTL CORPORATION BERHAD
Created by ChartStory72 | May 05, 2022
DSONIC (5216) The Story behind the Chart of DATASONIC GROUP BERHAD
Created by ChartStory72 | Apr 18, 2022
FRONTKN (0128) The Story behind the Chart of FRONTKEN CORP BHD
Created by ChartStory72 | Jan 18, 2022
ANNJOO (6556) The Story behind the Chart of ANN JOO RESOURCES BHD
Created by ChartStory72 | Jan 17, 2022
EVERGRN (5101) The Story behind the Chart of EVERGREEN FIBREBOARD BERHAD
Created by ChartStory72 | Jan 11, 2022
TEXCYCL (0089) The Story behind the Chart of TEX CYCLE TECHNOLOGY (M) BERHAD
Created by ChartStory72 | Jan 10, 2022
Wong (7050) The Story behind the Chart of WONG ENGINEERING CORPORATION BERHAD
Created by ChartStory72 | Jan 03, 2022
TOPGLOV ( 7113) The Story behind the Chart of TOP GLOVE CORP BHD
Created by ChartStory72 | Dec 06, 2021
Discussions
Be the first to like this. Showing 1 of 1 comments


speakup
this counter full of LUST!
2021-04-12 13:26