


KLSE Stocks Review
Dataprp 8338

ChartStory72
Publish date: Wed, 14 Apr 2021, 03:06 PM
ChartStory72
0 211
We post FREE chart reviews on KLSE daily Top Gainers and Most Actively Traded Counters. We are also giving out free reviews for our subs as well. Come join us on Telegram and PM us to learn more and request for the stocks you need reviewing for FREE.
Facebook : https://www.facebook.com/thechartstory
Telegram : https://t.me/thechartstory
Facebook : https://www.facebook.com/thechartstory
Telegram : https://t.me/thechartstory
One of the Top Most Actively Traded Counters for today.
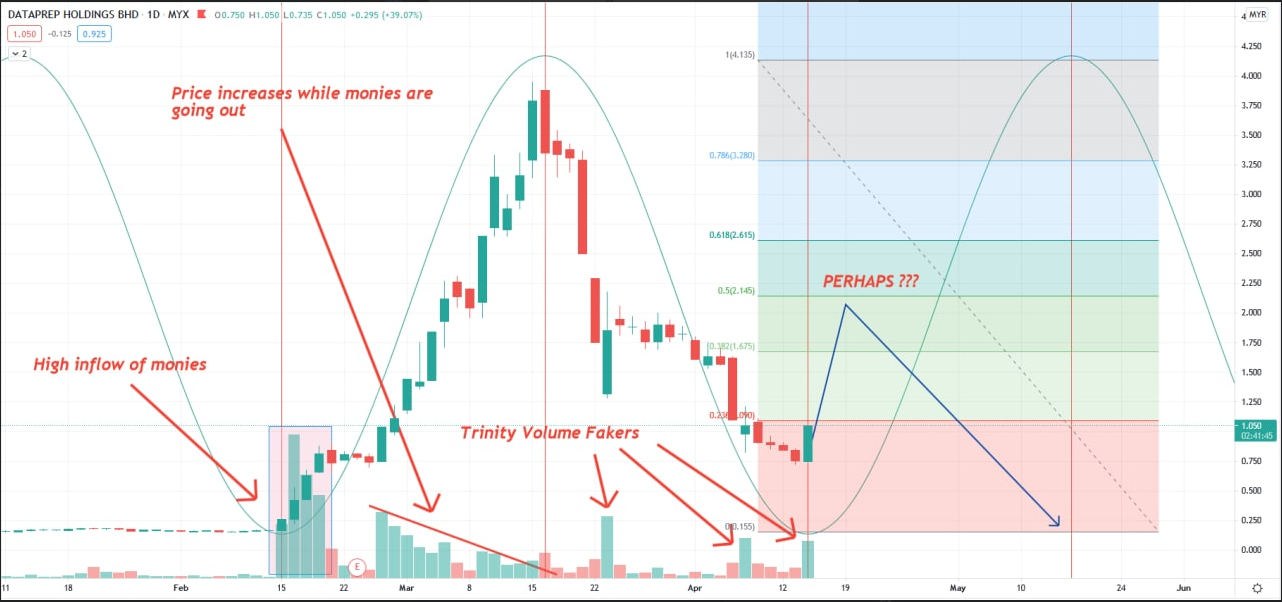
On Feb 2021 we see a large inflow of Monies collecting at the bottom. Prices rises quickly shortly after that. Notice when prices are rising vigorously, the volume is getting lower and lower. This is the sign that prices cannot sustain the higher peaks anymore and it is very obvious someone is behind the scenes doing some 'Goreng'.
Prices quickly tumbles and the cycle ends today as shown in the graph. By using the Time wave + Time Cycles we can predict the end of Cycle and the beginning of a new cycle. However, for this case it is very hard to predict a new cycle, prices MAYBE will go on a small uptrend before heading down lower BUT the % of it happening is VERY low.
The three fakers refers to the fake 'BUY' volume to lure retailers in as they thought the stock is about to comeback. As you can see prices went down instead of going higher.
Industry : Technology
In this fast-moving digital world, we get information in a few clicks.
However, we rarely get first-hand information and more often we get misleading news.
Investing in stocks today is very different from the past, but one thing hasn't changed - to study about a stock before putting money in.
A stock chart contains data that is publicly available and accurate by itself. By having certainty in data quality, we can comfortably study charts and make investment judgements.
At Chart Story, we believe stock prices move for a reason. Our objective is to share what we believe.
More articles on KLSE Stocks Review
YTL (0025) The Story behind the Chart of YTL CORPORATION BERHAD
Created by ChartStory72 | May 05, 2022
DSONIC (5216) The Story behind the Chart of DATASONIC GROUP BERHAD
Created by ChartStory72 | Apr 18, 2022
FRONTKN (0128) The Story behind the Chart of FRONTKEN CORP BHD
Created by ChartStory72 | Jan 18, 2022
ANNJOO (6556) The Story behind the Chart of ANN JOO RESOURCES BHD
Created by ChartStory72 | Jan 17, 2022
EVERGRN (5101) The Story behind the Chart of EVERGREEN FIBREBOARD BERHAD
Created by ChartStory72 | Jan 11, 2022
TEXCYCL (0089) The Story behind the Chart of TEX CYCLE TECHNOLOGY (M) BERHAD
Created by ChartStory72 | Jan 10, 2022
Wong (7050) The Story behind the Chart of WONG ENGINEERING CORPORATION BERHAD
Created by ChartStory72 | Jan 03, 2022
TOPGLOV ( 7113) The Story behind the Chart of TOP GLOVE CORP BHD
Created by ChartStory72 | Dec 06, 2021
Discussions
Be the first to like this. Showing 0 of 0 comments
Post a Comment
Featured Posts


Latest Videos


Apps


Top Articles
1
2
3
TA Sector Research
4
Koon Yew Yin's Blog
5
Good Articles to Share
Le Pen makes new threat to withdraw support for French government
6
Good Articles to Share
7
Good Articles to Share
US lawmakers say Hong Kong is becoming hub for financial crime — report
8
Good Articles to Share
Global airfares set to rise yet again in 2025, Amex report says
#
Stock
Score
Daily Stocks
Stock Name
Last
Change
Volume
Stock Name
Last
Change
Volume
Stock Name
Last
Change
Volume
MQ Trading Signals
Stock
Time
Signal
Duration
Stock
Time
Signal
Duration
Featured Advertisers / Partners


Ride The Bull Short The Bear
CS Tan
4.9 / 5.0
This book is the result of the author's many years of experience and observation throughout his 26 years in the stockbroking industry. It was written for general public to learn to invest based on facts and not on fantasies or hearsay....