KLSE Stocks Review
Matang 0189
ChartStory72
Publish date: Wed, 14 Apr 2021, 03:07 PM

Also another one of the Top Actively Traded Counters for today.
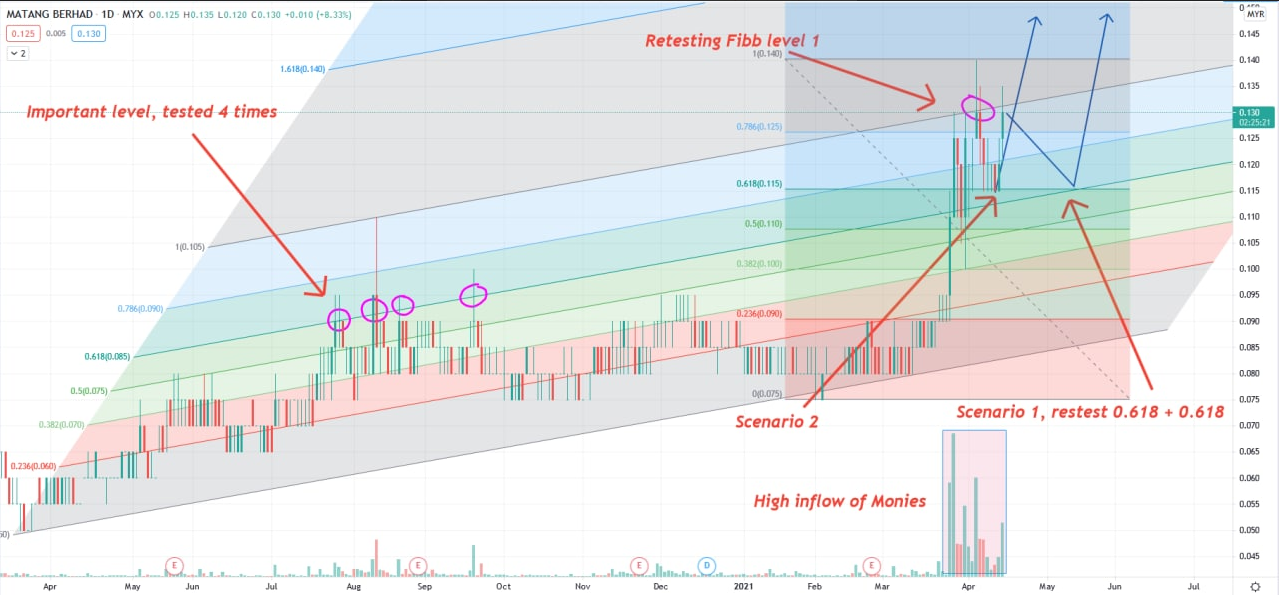
I detect a high inflow if Monies for the past 2 weeks and prices are now retesting the Fibb Level 1 area. Prices fail to break that level for the past few days.
From here on, there will be 2 scenarios that are about to happen.
Scenario 1 is where prices fail to break the Fibb level 1 resistance and it retraces to the 0.618 + 0.618 Fibb level. Why 0.618? Previously, we see that 0.618 had been tested 4 times, this indicates it is an important level. At the same time, the Fibb retracement level is also 0.618. By combining both 0.618 Fibb level we will know that it is indeed an important level.
Scenario 2 is where prices are strobf enough to break the Fibb level 1 Resistance and it will head to the next resistance of 1.618 + 1.618 Fibb Golden Ratio Level.
Both are shown with the blue line.
Industry : Plantation
In this fast-moving digital world, we get information in a few clicks.
However, we rarely get first-hand information and more often we get misleading news.
Investing in stocks today is very different from the past, but one thing hasn't changed - to study about a stock before putting money in.
A stock chart contains data that is publicly available and accurate by itself. By having certainty in data quality, we can comfortably study charts and make investment judgements.
At Chart Story, we believe stock prices move for a reason. Our objective is to share what we believe.
More articles on KLSE Stocks Review
YTL (0025) The Story behind the Chart of YTL CORPORATION BERHAD
Created by ChartStory72 | May 05, 2022
DSONIC (5216) The Story behind the Chart of DATASONIC GROUP BERHAD
Created by ChartStory72 | Apr 18, 2022
FRONTKN (0128) The Story behind the Chart of FRONTKEN CORP BHD
Created by ChartStory72 | Jan 18, 2022
ANNJOO (6556) The Story behind the Chart of ANN JOO RESOURCES BHD
Created by ChartStory72 | Jan 17, 2022
EVERGRN (5101) The Story behind the Chart of EVERGREEN FIBREBOARD BERHAD
Created by ChartStory72 | Jan 11, 2022
TEXCYCL (0089) The Story behind the Chart of TEX CYCLE TECHNOLOGY (M) BERHAD
Created by ChartStory72 | Jan 10, 2022
Wong (7050) The Story behind the Chart of WONG ENGINEERING CORPORATION BERHAD
Created by ChartStory72 | Jan 03, 2022
TOPGLOV ( 7113) The Story behind the Chart of TOP GLOVE CORP BHD
Created by ChartStory72 | Dec 06, 2021
Discussions
Be the first to like this. Showing 0 of 0 comments


