KLSE Stocks Review
Dufu 7233
ChartStory72
Publish date: Wed, 14 Apr 2021, 03:08 PM

One of the Top Gainers Counters for today.
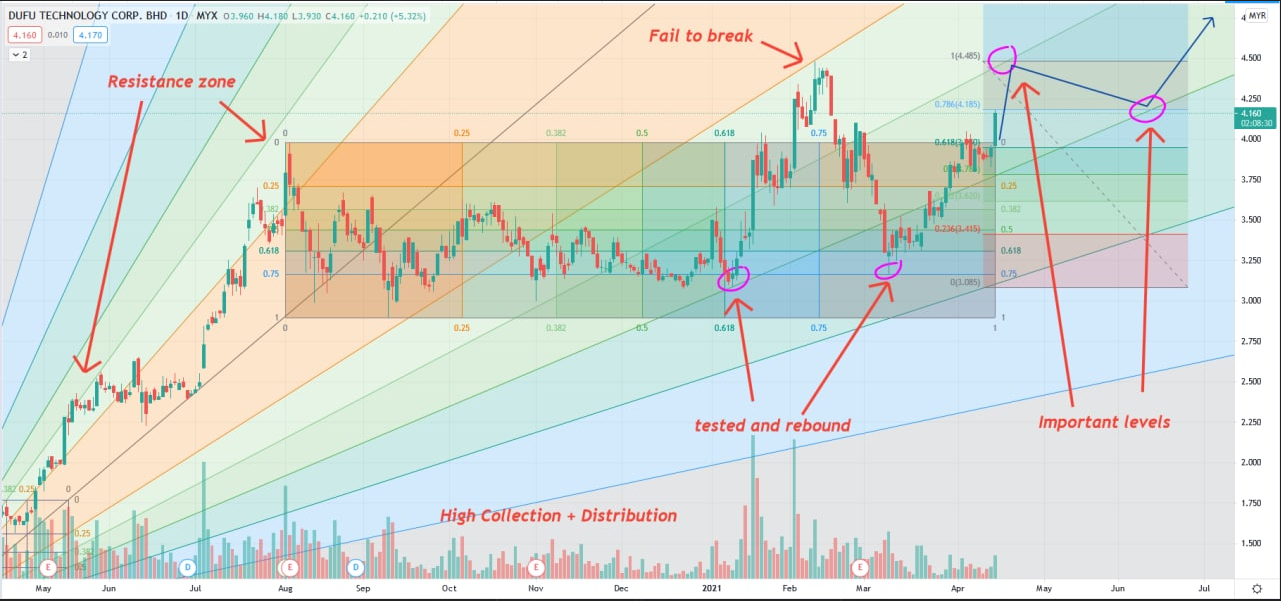
Prices had been on an uptrend since March 2020 and it entered into a massive ranging since Aug 2020. After drawing all the resistance zones we know that the 0.25 Fibb resistance is a respectable resistance zone as when prices broke out from the range on Feb 2021, prices were unable to break the Trend Resistance of 0.25. After that prices went back into the range.
Today we are a breakout from the range again and there is a high possibility that prices will head higher, but to where? There are 2 key areas which are circled in purple with the blue line.
1st key level, the Fibb level 1 + the 0.382 level, strong resistance zone.
2nd key level, the Fibb level of 0.786 + 0.5 level, strong support zone.
Take a guess what to to with those levels.
Industry : Technology
In this fast-moving digital world, we get information in a few clicks.
However, we rarely get first-hand information and more often we get misleading news.
Investing in stocks today is very different from the past, but one thing hasn't changed - to study about a stock before putting money in.
A stock chart contains data that is publicly available and accurate by itself. By having certainty in data quality, we can comfortably study charts and make investment judgements.
At Chart Story, we believe stock prices move for a reason. Our objective is to share what we believe.
More articles on KLSE Stocks Review
YTL (0025) The Story behind the Chart of YTL CORPORATION BERHAD
Created by ChartStory72 | May 05, 2022
DSONIC (5216) The Story behind the Chart of DATASONIC GROUP BERHAD
Created by ChartStory72 | Apr 18, 2022
FRONTKN (0128) The Story behind the Chart of FRONTKEN CORP BHD
Created by ChartStory72 | Jan 18, 2022
ANNJOO (6556) The Story behind the Chart of ANN JOO RESOURCES BHD
Created by ChartStory72 | Jan 17, 2022
EVERGRN (5101) The Story behind the Chart of EVERGREEN FIBREBOARD BERHAD
Created by ChartStory72 | Jan 11, 2022
TEXCYCL (0089) The Story behind the Chart of TEX CYCLE TECHNOLOGY (M) BERHAD
Created by ChartStory72 | Jan 10, 2022
Wong (7050) The Story behind the Chart of WONG ENGINEERING CORPORATION BERHAD
Created by ChartStory72 | Jan 03, 2022
TOPGLOV ( 7113) The Story behind the Chart of TOP GLOVE CORP BHD
Created by ChartStory72 | Dec 06, 2021
Discussions
Be the first to like this. Showing 0 of 0 comments


