KLSE Stocks Review
Willow 0008
ChartStory72
Publish date: Wed, 28 Apr 2021, 02:58 PM

Willow 0008
Requested by one of our subscribers. PM us on Facebook to get yours too.
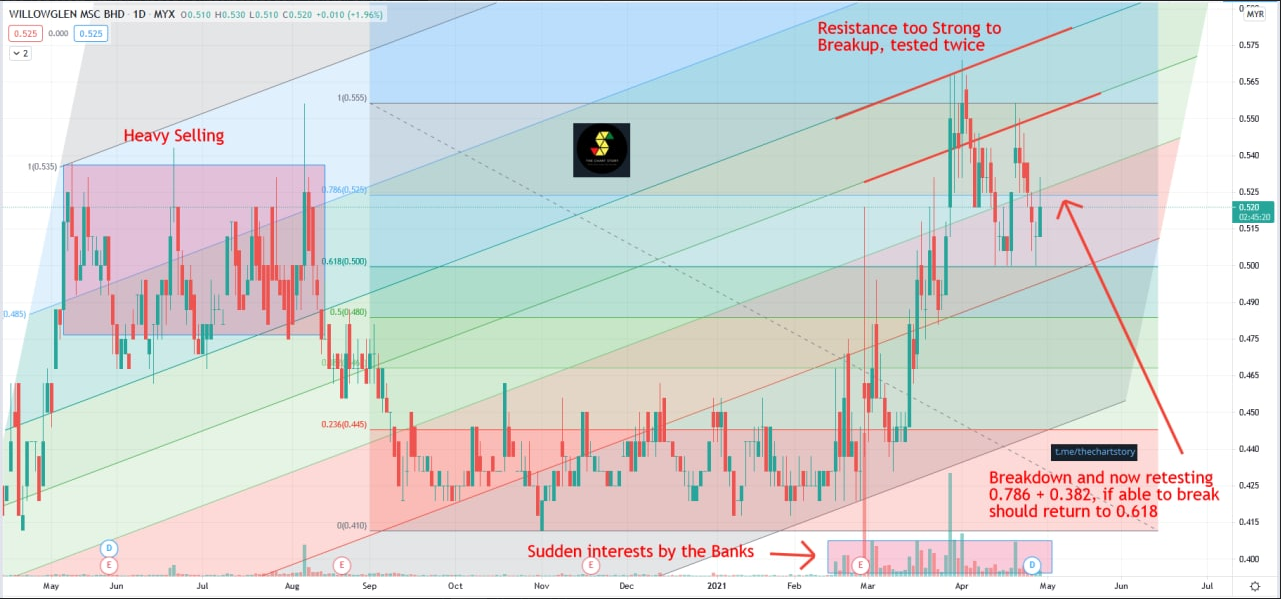
Overall prices are in a ranging uptrend. Previously we see a heavy selling at the Fibo area between 0.618 till 0.786. Keep in mind, that area had many 'Trapped' souls.
Moving on, we see a strong rally during March this year. Prices rallied back to the 0.618 fibo area and were not able to breakthrough that area, why? Now remember the 'Trapped' souls i mentioned above? That area is now off limits till whoever had been trapped previously sell all of their positions.
Today we see prices are testing an important area of 0.786 + 0.382 Fibo level. If prices are able to breakup this area, prices should rally back to the 'Off Limits' Area. Otherwise, prices will continue dropping.
Industry : Technology.
In this fast-moving digital world, we get information in a few clicks.
However, we rarely get first-hand information and more often we get misleading news.
Investing in stocks today is very different from the past, but one thing hasn't changed - to study about a stock before putting money in.
A stock chart contains data that is publicly available and accurate by itself. By having certainty in data quality, we can comfortably study charts and make investment judgements.
At Chart Story, we believe stock prices move for a reason. Our objective is to share what we believe.
More articles on KLSE Stocks Review
YTL (0025) The Story behind the Chart of YTL CORPORATION BERHAD
Created by ChartStory72 | May 05, 2022
DSONIC (5216) The Story behind the Chart of DATASONIC GROUP BERHAD
Created by ChartStory72 | Apr 18, 2022
FRONTKN (0128) The Story behind the Chart of FRONTKEN CORP BHD
Created by ChartStory72 | Jan 18, 2022
ANNJOO (6556) The Story behind the Chart of ANN JOO RESOURCES BHD
Created by ChartStory72 | Jan 17, 2022
EVERGRN (5101) The Story behind the Chart of EVERGREEN FIBREBOARD BERHAD
Created by ChartStory72 | Jan 11, 2022
TEXCYCL (0089) The Story behind the Chart of TEX CYCLE TECHNOLOGY (M) BERHAD
Created by ChartStory72 | Jan 10, 2022
Wong (7050) The Story behind the Chart of WONG ENGINEERING CORPORATION BERHAD
Created by ChartStory72 | Jan 03, 2022
TOPGLOV ( 7113) The Story behind the Chart of TOP GLOVE CORP BHD
Created by ChartStory72 | Dec 06, 2021
Discussions
Be the first to like this. Showing 0 of 0 comments


