KLSE Stocks Review
SerSol 0055
ChartStory72
Publish date: Fri, 28 May 2021, 06:26 PM

SerSol 0055
Requested by one of our subs as well.
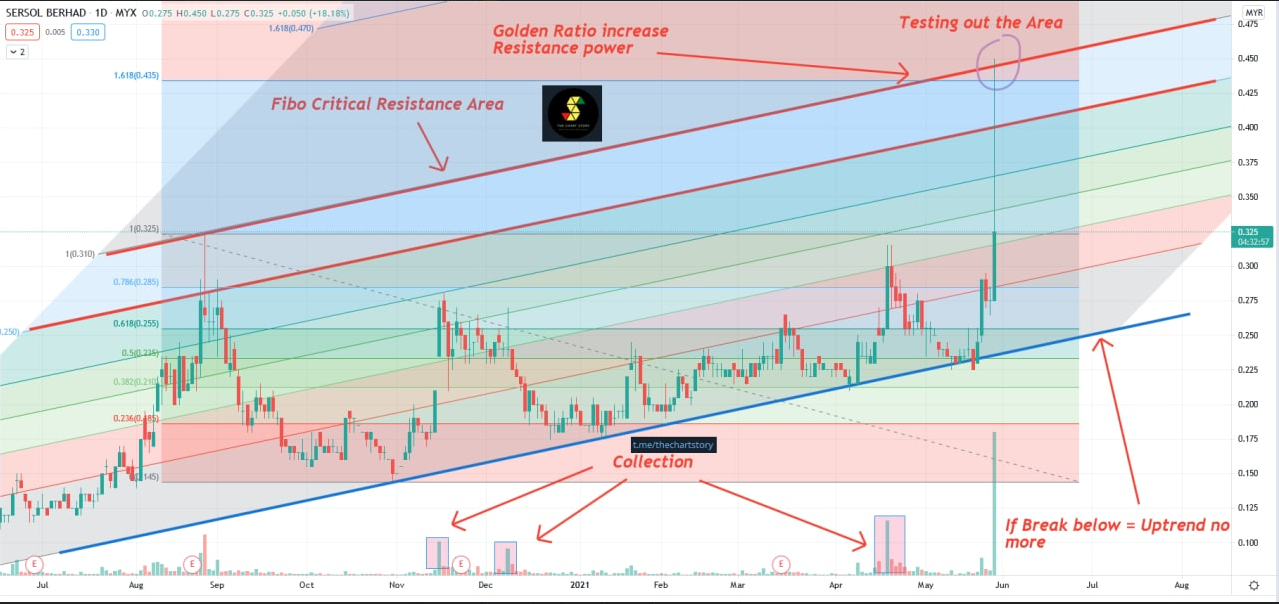
Recently I see lots of stocks that have the same pattern. Rangy uptrend + a spike in the end. Coincidence? Honestly I am not sure too myself but one thing I know for sure, same pattern means easy profits because it is predictable.
Multiple collections can be seen if you pay attention. The spike today could not break the Fibo Resistance Level 1 + 1.618 Golden Ratio level. I call this the Dynamic Resistance Duo. Where the resistance is too strong for prices to just spike through. However, if prices are able to break that level, we will see a super strong rally, perhaps even the 2.618 level.
Industry : Industrial Products & Services.
In this fast-moving digital world, we get information in a few clicks.
However, we rarely get first-hand information and more often we get misleading news.
Investing in stocks today is very different from the past, but one thing hasn't changed - to study about a stock before putting money in.
A stock chart contains data that is publicly available and accurate by itself. By having certainty in data quality, we can comfortably study charts and make investment judgements.
At Chart Story, we believe stock prices move for a reason. Our objective is to share what we believe.
More articles on KLSE Stocks Review
YTL (0025) The Story behind the Chart of YTL CORPORATION BERHAD
Created by ChartStory72 | May 05, 2022
DSONIC (5216) The Story behind the Chart of DATASONIC GROUP BERHAD
Created by ChartStory72 | Apr 18, 2022
FRONTKN (0128) The Story behind the Chart of FRONTKEN CORP BHD
Created by ChartStory72 | Jan 18, 2022
ANNJOO (6556) The Story behind the Chart of ANN JOO RESOURCES BHD
Created by ChartStory72 | Jan 17, 2022
EVERGRN (5101) The Story behind the Chart of EVERGREEN FIBREBOARD BERHAD
Created by ChartStory72 | Jan 11, 2022
TEXCYCL (0089) The Story behind the Chart of TEX CYCLE TECHNOLOGY (M) BERHAD
Created by ChartStory72 | Jan 10, 2022
Wong (7050) The Story behind the Chart of WONG ENGINEERING CORPORATION BERHAD
Created by ChartStory72 | Jan 03, 2022
TOPGLOV ( 7113) The Story behind the Chart of TOP GLOVE CORP BHD
Created by ChartStory72 | Dec 06, 2021
Discussions
Be the first to like this. Showing 0 of 0 comments


