


KLSE Stocks Review
KANGER 0170 KANGER INTERNATIONAL BHD

ChartStory72
Publish date: Mon, 31 May 2021, 02:33 PM
ChartStory72
0 211
We post FREE chart reviews on KLSE daily Top Gainers and Most Actively Traded Counters. We are also giving out free reviews for our subs as well. Come join us on Telegram and PM us to learn more and request for the stocks you need reviewing for FREE.
Facebook : https://www.facebook.com/thechartstory
Telegram : https://t.me/thechartstory
Facebook : https://www.facebook.com/thechartstory
Telegram : https://t.me/thechartstory
It all started on 25th March of 2021. A series of analysis in our Telegram Group.
25th March 2021 Analysis
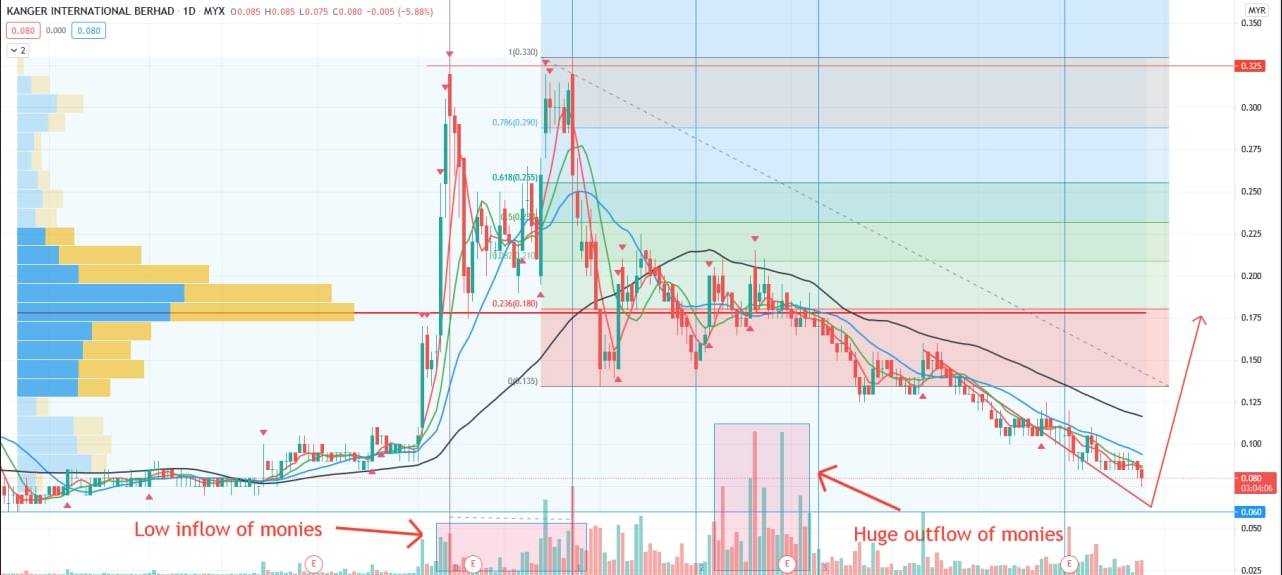
Double huge rally during the period August till October last year causing prices to for a double top. At the same time it is very obvious that the rally is the good ol pump and dump. This is because the volume does not aligned with the uptrend surge as there were low inflows of monies.
The 2nd small rally happened during November is where fund houses are trying to push the prices higher to dump all their remaining stocks before letting the prices go down south.
However, not all hope is lost as you can see prices are slowly approaching a mojor support level where prices have a high chance of rebounding higher towards where most funds are at.
Have you noticed that the level where most funds are at is also the 0.236 level of the fibo retracement?
Update on the 24th May 2021
24th May 2021 Analysis
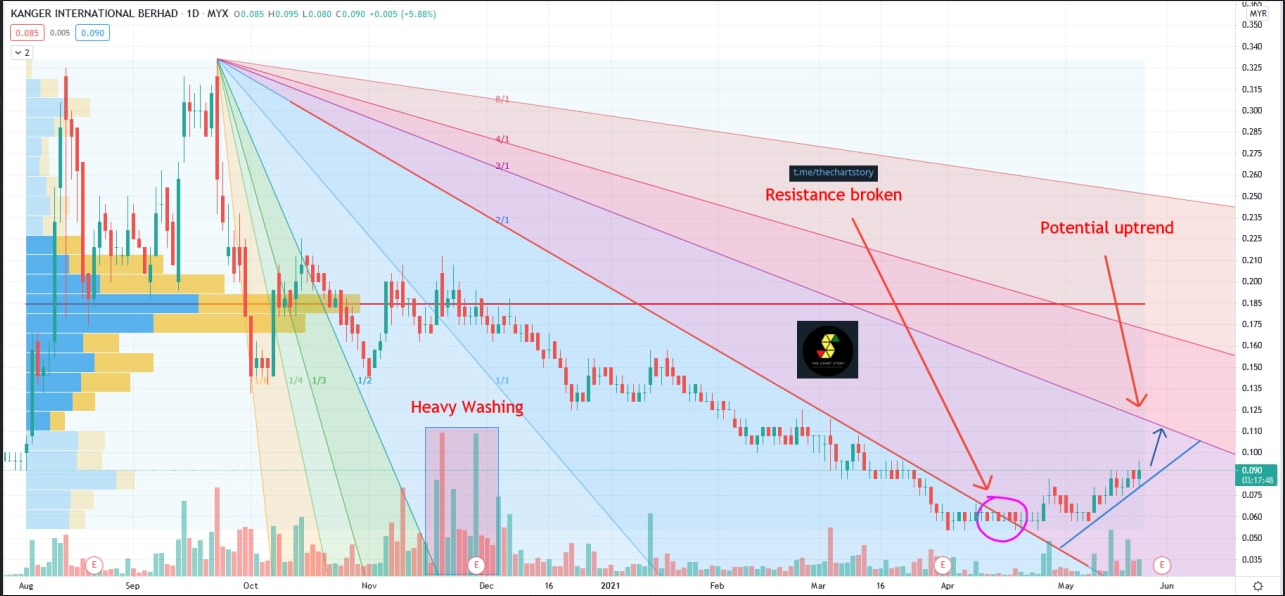
After two long months, finally some action from Kanger. In the previous analysis, I mentioned that prices will continue to drop lower till at least RM 0.06 and today is the prove that I need to show as prices indeed went ALL the way down towards the 0.06 level and starting to rebound. Another prove on how powerful the Fibonacci Tools are, IF used correctly.
Okay, enough of that, in the short term, prices are expected to test the resistance level of 3/1, if prices are able to break that level, prices will definitely head up higher.
Update today 31st May 2021
31st May 2021 Analaysis
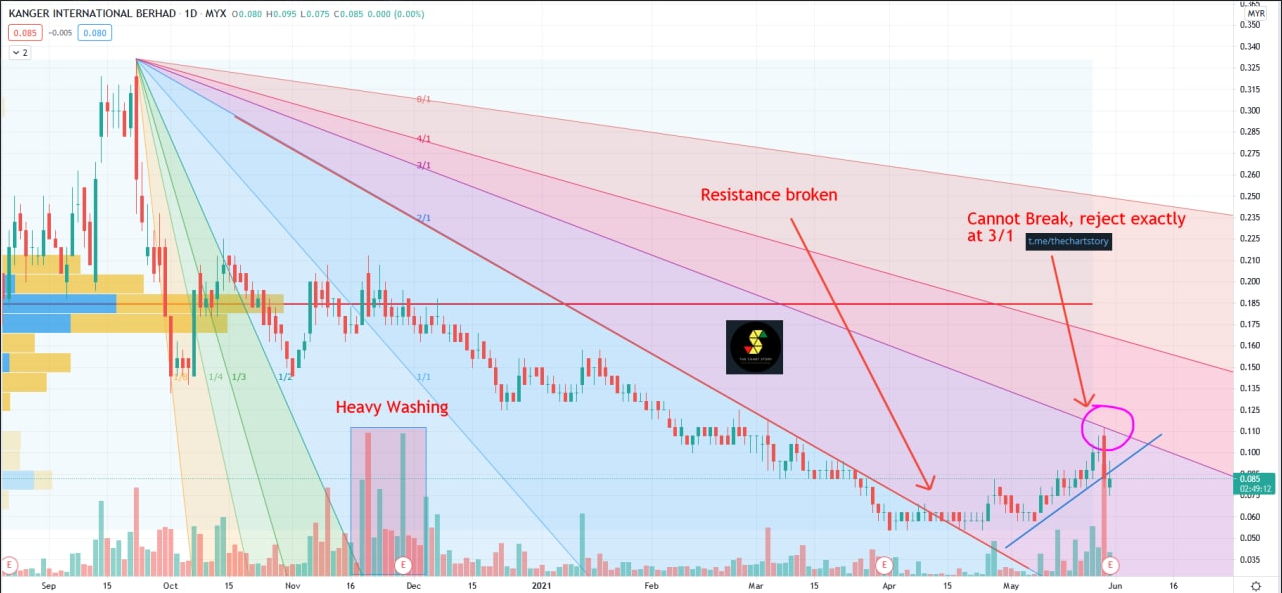
As mentioned previously, prices needed to break that 3/1 Resistance level in order for prices to resume uptrend. However here, we see a strong rejection Exactly at the 3/1, this indicates weakness and possibly the resumption of downtrend. (Another accurate prediction by fibo again)
Will not be adding this into your buying list unless prices are able to break above the 3/1 resistance. Otherwise, please stay out unless we can short the market.
Hope you enjoy our three series of analysis on Kanger from us, hope this shows how good the Advanced Fibonacci Analysis is, follow us on Telegram and you can get a FREE chart analysis from us and hope you are able to get benefits from our analysis as well.
In this fast-moving digital world, we get information in a few clicks.
However, we rarely get first-hand information and more often we get misleading news.
Investing in stocks today is very different from the past, but one thing hasn't changed - to study about a stock before putting money in.
A stock chart contains data that is publicly available and accurate by itself. By having certainty in data quality, we can comfortably study charts and make investment judgements.
At Chart Story, we believe stock prices move for a reason. Our objective is to share what we believe.
More articles on KLSE Stocks Review
YTL (0025) The Story behind the Chart of YTL CORPORATION BERHAD
Created by ChartStory72 | May 05, 2022
DSONIC (5216) The Story behind the Chart of DATASONIC GROUP BERHAD
Created by ChartStory72 | Apr 18, 2022
FRONTKN (0128) The Story behind the Chart of FRONTKEN CORP BHD
Created by ChartStory72 | Jan 18, 2022
ANNJOO (6556) The Story behind the Chart of ANN JOO RESOURCES BHD
Created by ChartStory72 | Jan 17, 2022
EVERGRN (5101) The Story behind the Chart of EVERGREEN FIBREBOARD BERHAD
Created by ChartStory72 | Jan 11, 2022
TEXCYCL (0089) The Story behind the Chart of TEX CYCLE TECHNOLOGY (M) BERHAD
Created by ChartStory72 | Jan 10, 2022
Wong (7050) The Story behind the Chart of WONG ENGINEERING CORPORATION BERHAD
Created by ChartStory72 | Jan 03, 2022
TOPGLOV ( 7113) The Story behind the Chart of TOP GLOVE CORP BHD
Created by ChartStory72 | Dec 06, 2021
Discussions
Be the first to like this. Showing 0 of 0 comments
Post a Comment
Featured Posts
Introducing MY's First IPO Fund for Sophisticated Investors!
New Update. Discover investment communities that resonate with your ideas
M & A Value Partners IPO Equity Fund has been launched - Targeted 13% Return p.a
Latest Videos


Apps


Top Articles
1
2
3
TA Sector Research
4
Koon Yew Yin's Blog
5
Good Articles to Share
Le Pen makes new threat to withdraw support for French government
6
Good Articles to Share
7
Good Articles to Share
US lawmakers say Hong Kong is becoming hub for financial crime — report
8
Good Articles to Share
Global airfares set to rise yet again in 2025, Amex report says
#
Stock
Score
Daily Stocks
Stock Name
Last
Change
Volume
Stock Name
Last
Change
Volume
Stock Name
Last
Change
Volume
MQ Trading Signals
Stock
Time
Signal
Duration
Stock
Time
Signal
Duration
Featured Advertisers / Partners


Ride The Bull Short The Bear
CS Tan
4.9 / 5.0
This book is the result of the author's many years of experience and observation throughout his 26 years in the stockbroking industry. It was written for general public to learn to invest based on facts and not on fantasies or hearsay....