


Icon8888 Gossips About Stocks
(Icon) Pansar Bhd - Supplier of Industrial Equipment, Construction Products, etc

|
Open
0.45
|
Previous Close
0.45
|
|
|
Day High
0.46
|
Day Low
0.45
|
|
|
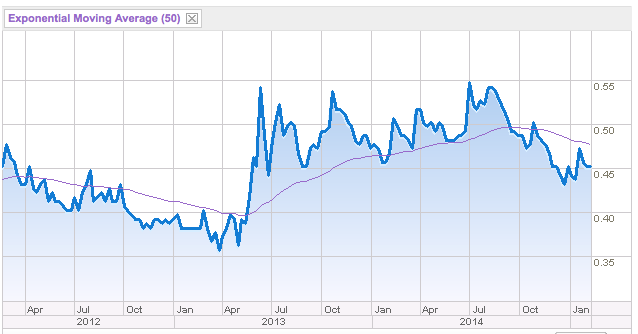
52 Week High
08/6/14 - 0.56
|
52 Week Low
12/15/14 - 0.42
|
|
|
Market Cap
126.0M
|
Average Volume 10 Days
37.3K
|
|
|
EPS TTM
0.04
|
Shares Outstanding
280.0M
|
|
|
EX-Date
09/5/14
|
P/E TM
10.1x
|
|
|
Dividend
0.02
|
Dividend Yield
5.00%
|
Pansar Berhad is formerly known as PWE Industries Bhd.
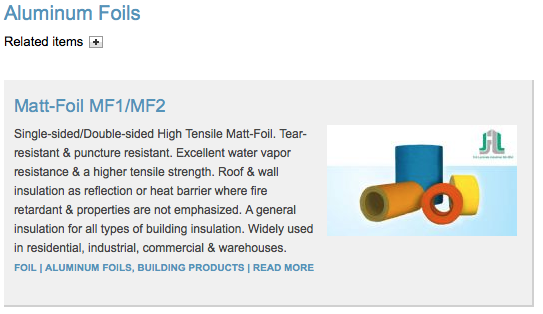
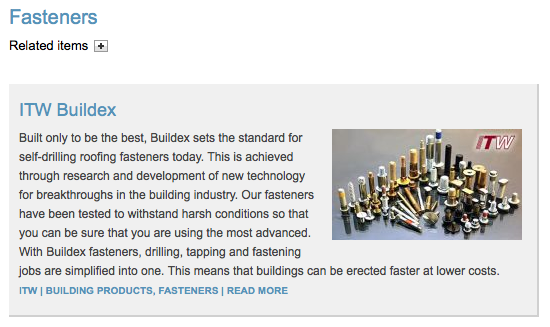
The company’s Building Products segment sells and distributes steel bars, cement, roofing materials, construction chemicals, and industrial materials.
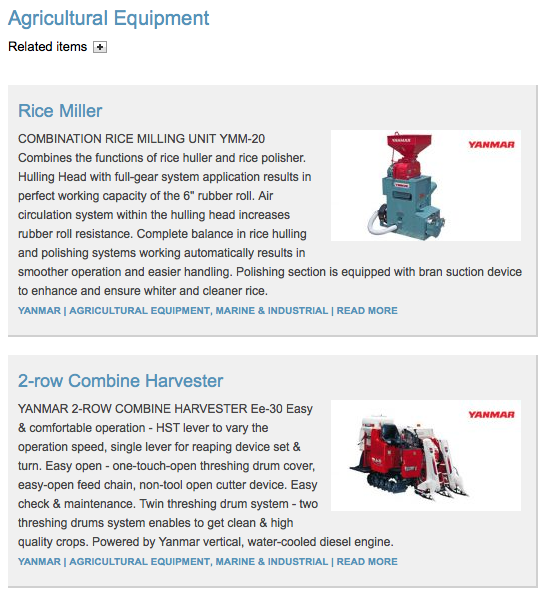
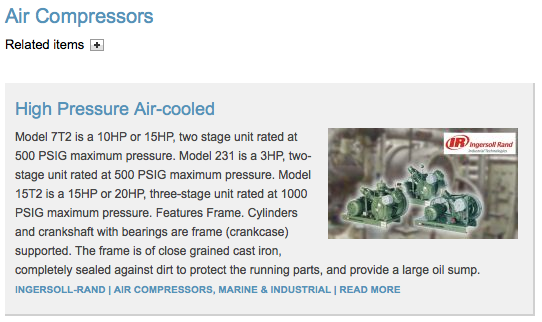
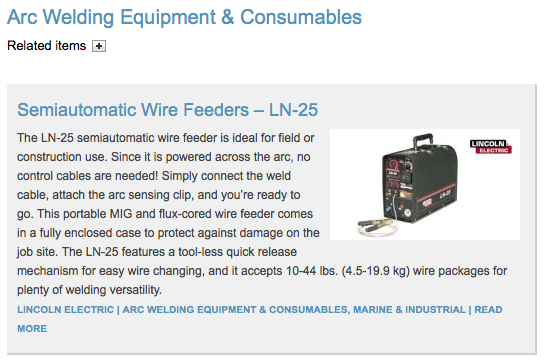
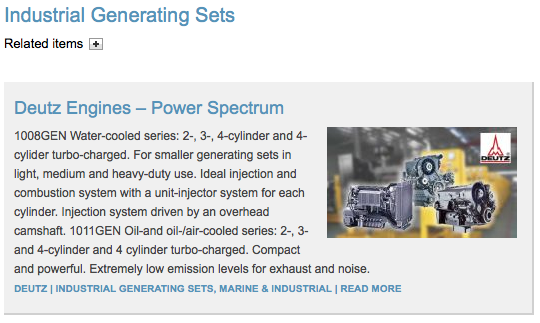
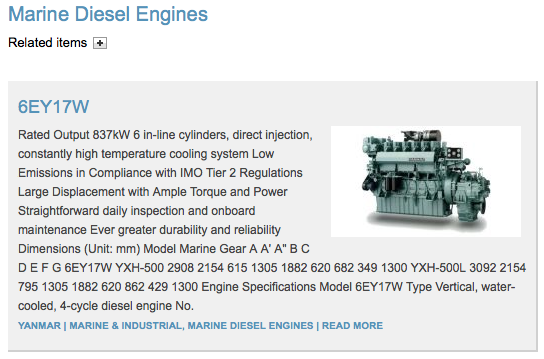
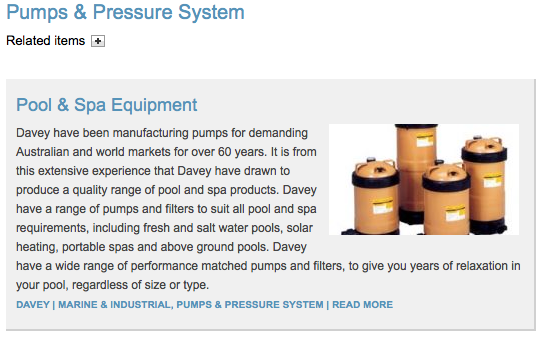
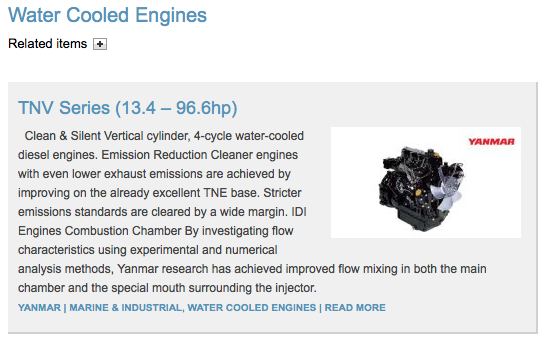
Its Marine and Industrial segment supplies and distributes power generating and water pressure systems, welding and pump sets, etc.
The company’s Wood Engineering and Supplies segment supplies steel wire ropes, packaging systems, precision measuring instruments, and wood treatment chemicals, etc.
Its Electrical and Office Automation segment sells and distributes lighting and air-conditioning systems. This segment also provides office automation solutions, including photocopier, fax machines and key phones, and computers, etc.
The company’s Mechanical and Electrical segment designs and installs air-conditioning and ventilation, plumbing, and fire protection systems.
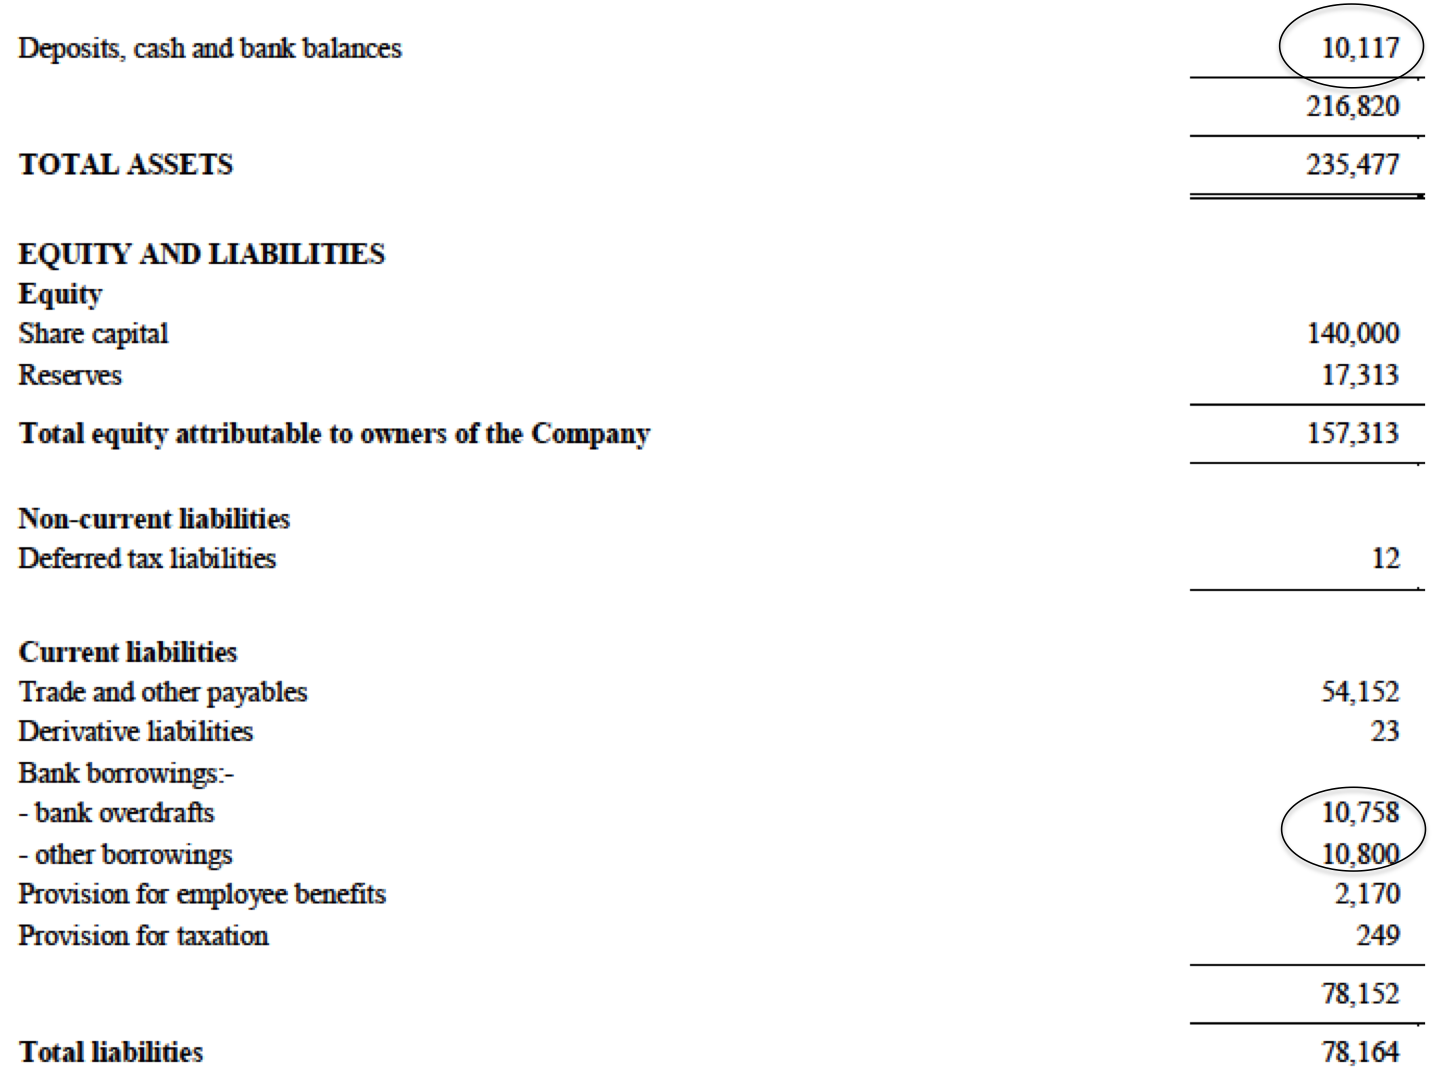
Strong balance sheets with almost zero gearing :-
Consistent earnings over past few years :-
Quarter Result:
| F.Y. | Quarter | Revenue ('000) | Profit before Tax ('000) | Profit Attb. to SH ('000) | EPS (Cent) | DPS (Cent) | NAPS |
|---|---|---|---|---|---|---|---|
| 2015-03-31 | 2014-12-31 | 101,378 | 3,357 | 2,435 | 0.87 | - | 0.5600 |
| 2015-03-31 | 2014-09-30 | 104,660 | 5,876 | 4,200 | 1.50 | 2.25 | 0.5500 |
| 2015-03-31 | 2014-06-30 | 102,149 | 5,519 | 3,984 | 1.42 | - | 0.5600 |
| 2014-03-31 | 2014-03-31 | 86,835 | 2,343 | 1,776 | 0.63 | - | 0.5500 |
| 2014-03-31 | 2013-12-31 | 118,026 | 6,225 | 4,606 | 1.65 | - | 0.5400 |
| 2014-03-31 | 2013-09-30 | 116,738 | 5,854 | 4,341 | 1.55 | 2.00 | 0.5300 |
| 2014-03-31 | 2013-06-30 | 104,191 | 5,031 | 3,753 | 1.34 | - | 0.5300 |
| 2013-03-31 | 2013-03-31 | 100,477 | 4,129 | 3,078 | 1.10 | - | - |
| 2013-03-31 | 2012-12-31 | 112,980 | 4,911 | 3,870 | 1.38 | - | 0.5000 |
| 2013-03-31 | 2012-09-30 | 107,900 | 7,160 | 5,280 | 1.89 | 2.00 | 0.4900 |
| 2013-03-31 | 2012-06-30 | 108,578 | 7,002 | 5,232 | 1.87 | - | 0.4900 |
| 2012-03-31 | 2012-03-31 | 92,031 | 2,311 | 1,455 | 0.52 | - | - |
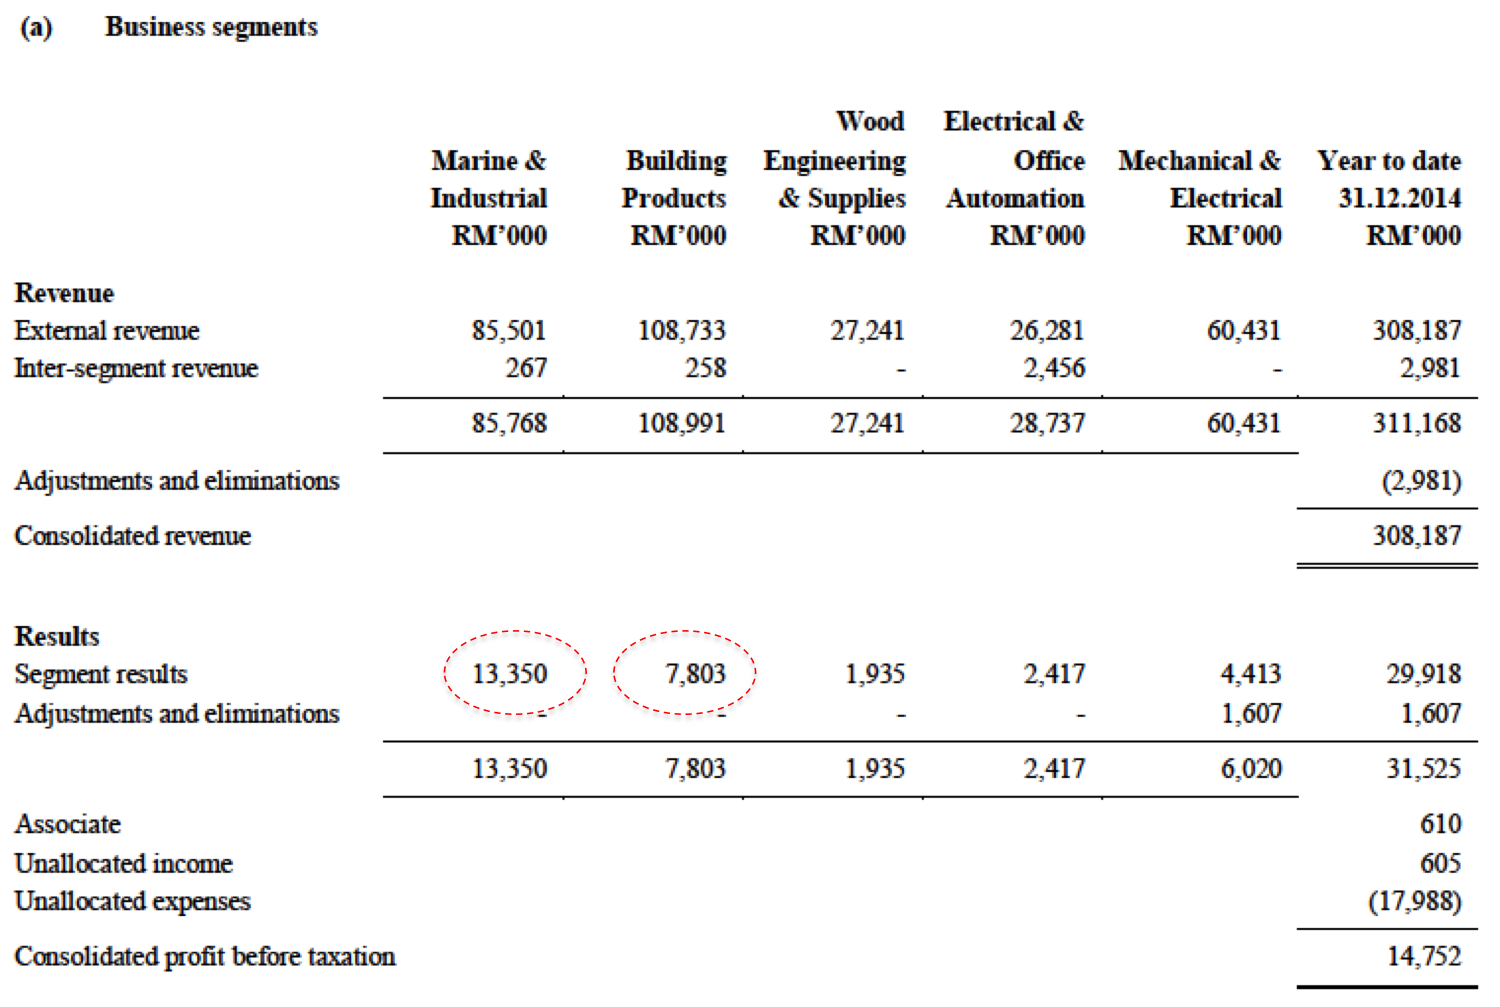
As can be seen below, marine / industrial and building products accounts for the bulk of the earnings. As such, I will incorporate more information of these two divisions into this article.
Marine / industrial division distributes the following equipment :-
Building products division distributes the follwoing equipment :-

Related Stocks
| Chart | Stock Name | Last | Change | Volume |
|---|
Market Buzz
More articles on Icon8888 Gossips About Stocks
(Icon) Jaks Resources - IRR Model Shows That RM300 mil Net Profit p.a. For 30% Stake Is Plausible
Created by Icon8888 | May 01, 2020
(Icon) Notion VTec - Forget About The Virus, It Is Time To Rock and Roll
Created by Icon8888 | Mar 10, 2020
(Icon) Sam Engineering - Excellent Result. Share Price Can Potentially Double Within 2 Years
Created by Icon8888 | Mar 01, 2020
(Icon) Alliance Bank - One Off Provision Affected Previous Quarter Earning. Time To Buy On Weakness
Created by Icon8888 | Nov 13, 2019
Discussions
Be the first to like this. Showing 3 of 3 comments
you are welcomed matakuda. The info I presented is very basic. But at least it kick start the process of knowing this company (and many others)
2015-02-16 10:26
Post a Comment
Featured Posts


Latest Videos


MQ Trading Signals
Time
Signal
Duration
Type
2024-07-23 14:30:00
EMA 5
30 Mins
BUY
2024-07-23 11:20:00
EMA 5
10 Mins
BUY
2024-07-23 11:20:00
ADX
10 Mins
BUY
2024-07-23 11:20:00
OBV
10 Mins
BUY
2024-07-23 11:20:00
EMA 5
5 Mins
BUY
Apps


Top Articles
1
BFM Podcast
2
Koon Yew Yin's Blog
3
CGS-CIMB Research
Genting Plantations - Proposed Land Acquisition in Indonesia
5
save malaysia!
6
Koon Yew Yin's Blog
7
save malaysia!
8
#
Stock
Score
Daily Stocks
Stock Name
Last
Change
Volume
Stock Name
Last
Change
Volume
Stock Name
Last
Change
Volume
Featured Advertisers / Partners


Ride The Bull Short The Bear
CS Tan
4.9 / 5.0
This book is the result of the author's many years of experience and observation throughout his 26 years in the stockbroking industry. It was written for general public to learn to invest based on facts and not on fantasies or hearsay....
matakuda
Drop in quarterly earning, so as its share price. 130k volume done as of now, considered relatively high volume for this counter. This presents opportunity to accumulate. Add 25k into my portfolio. TQ icon8888.
2015-02-16 10:18