


Icon8888 Gossips About Stocks
(Icon) Century Bond - Heightened Competition Drove Down Profit Margin


(The company's logo is very interesting. The C and B grouped together forms the Chinese word for "Good")
Executive Summary
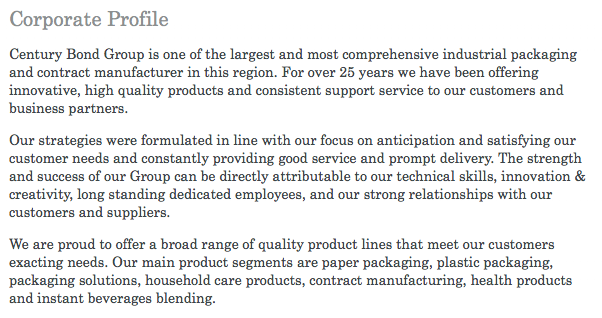
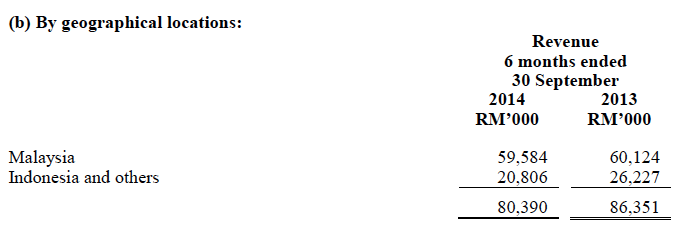
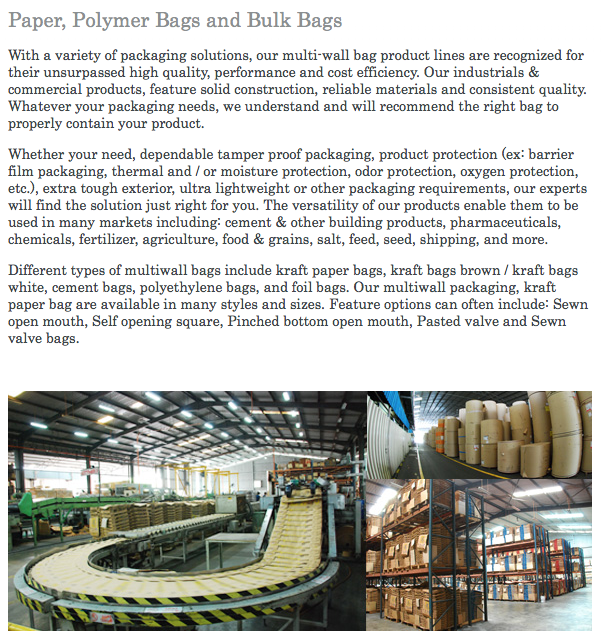
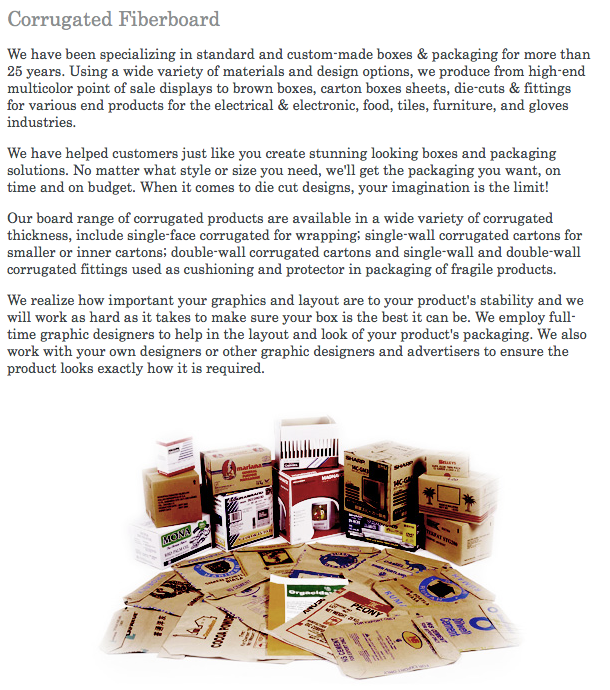
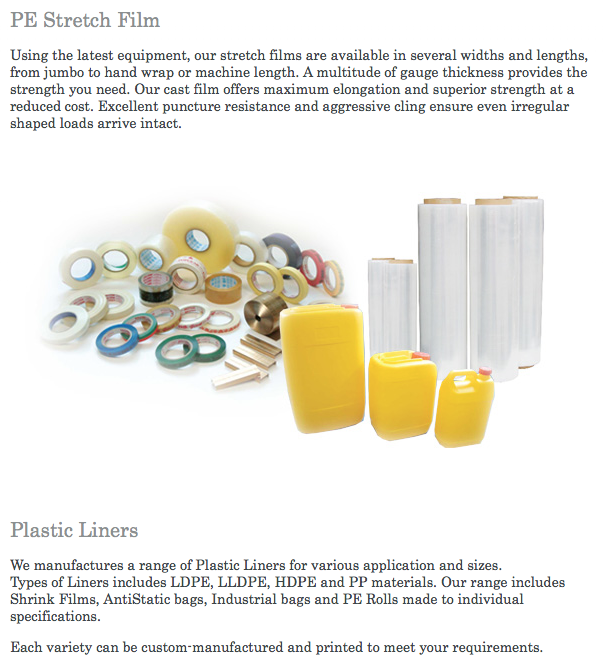
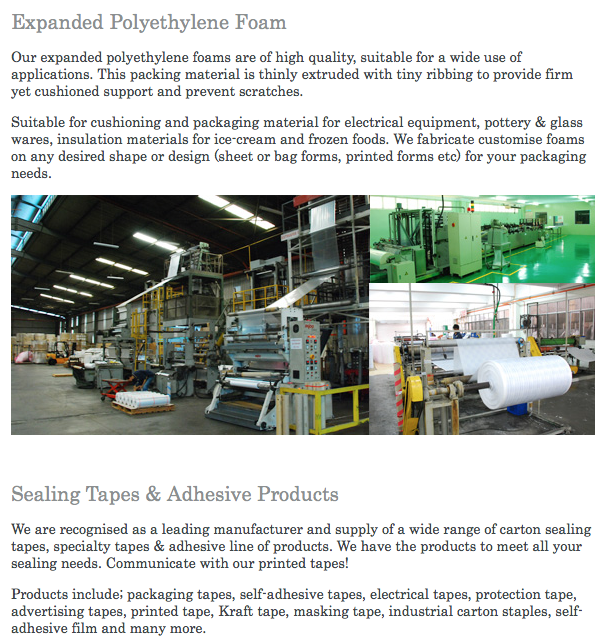
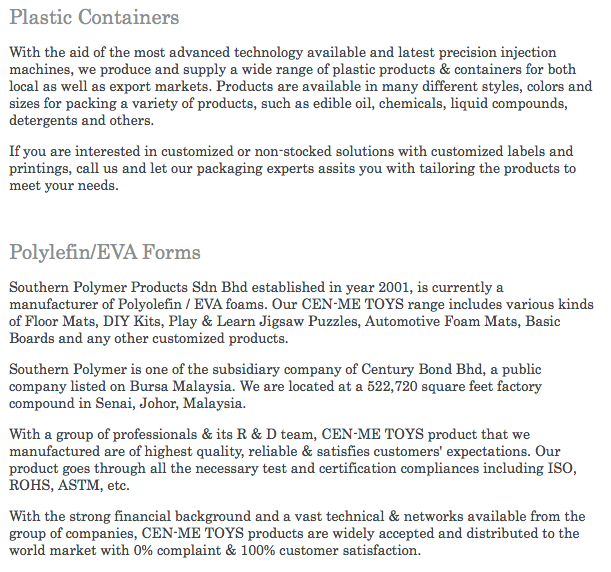
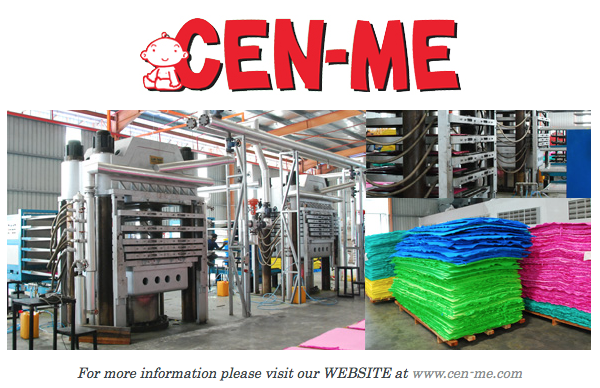
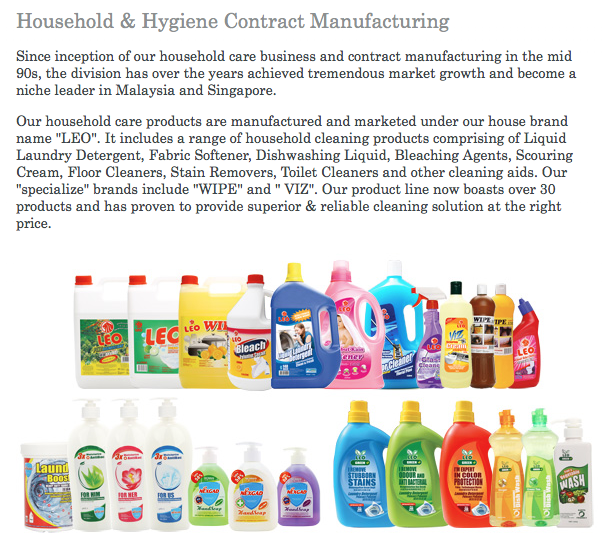
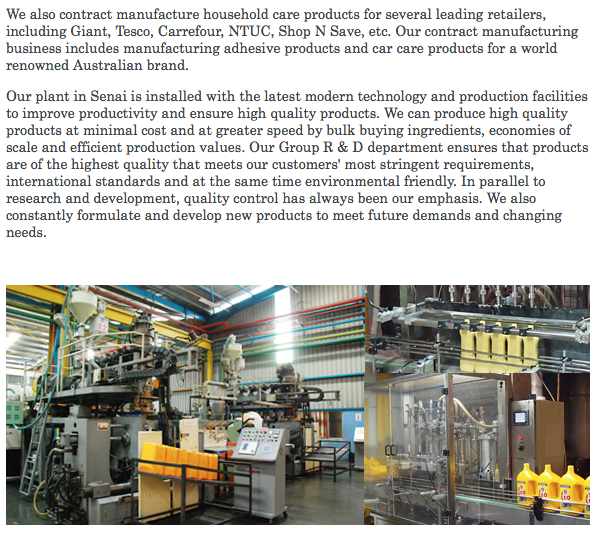
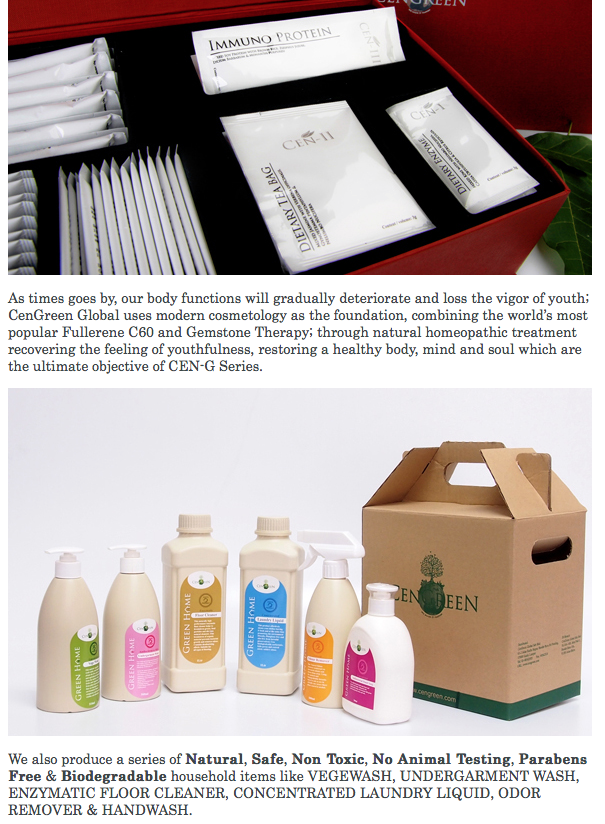
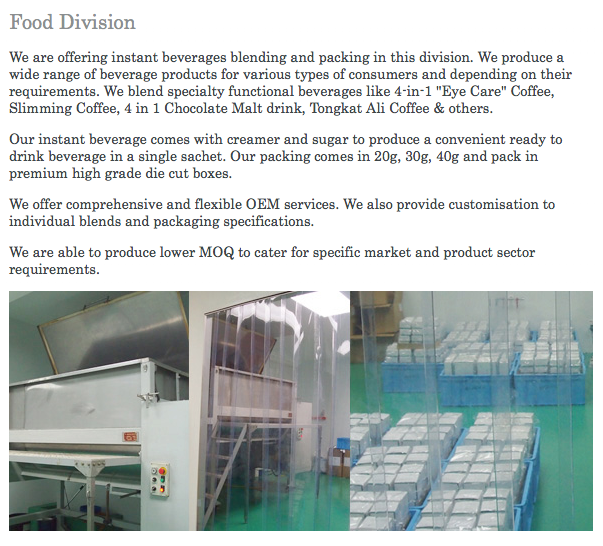
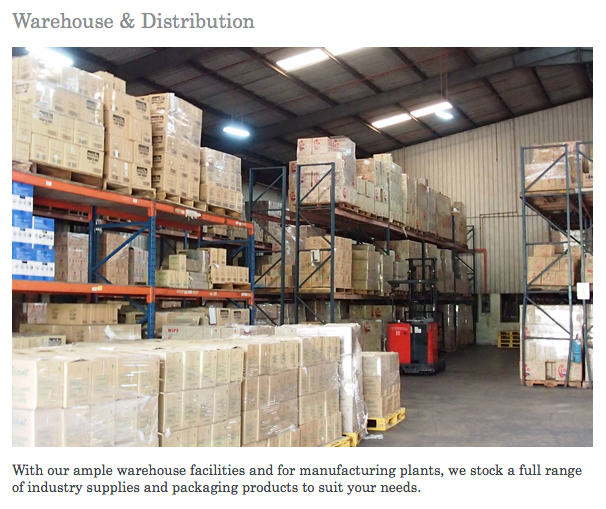
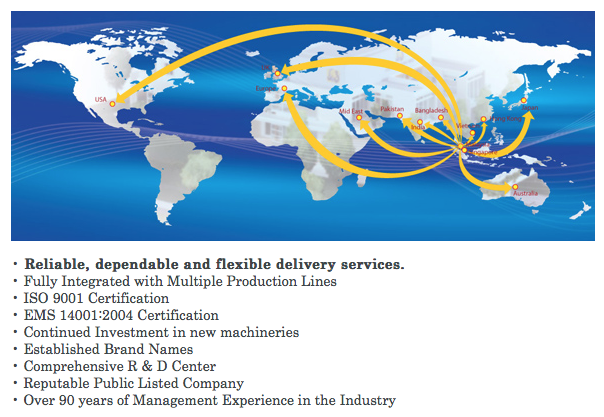
(a) You will be awed if you look at the Company's corporate website. It states that it is involved in paper and plastic based packaging, contract manufacturing of consumer products, multi level marketing and warehousing / distribution. However, upon closer inspection, the bulk of the group's revenue is actually derived from paper packaging. The company is principally based in Johor.
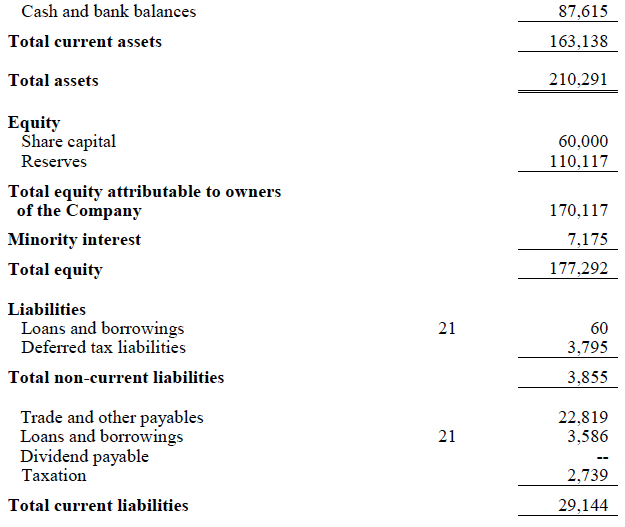
(b) Having said so, the company is well run, as evidenced by many years of consistent profitability. Balance sheet is pristine, with limited borrowings and cash per share of RM0.73, representing closed to 60% of existing share price.
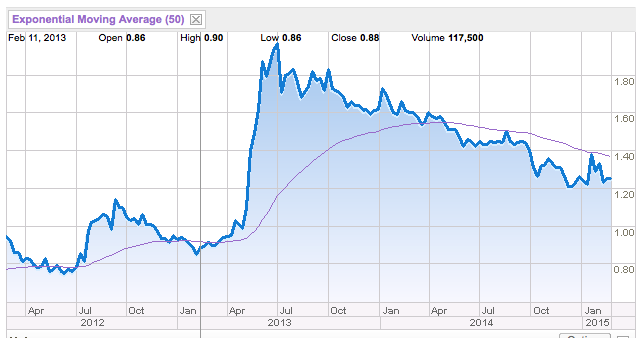
(c) Share price has been on downward trend since mid 2013. Latest few quarters results were weak due to heightened competition experienced by its core earnings contributor (paper packaging division).
(d) In my opinion, the decline in profitability is structural in nature. Unless its competitors go out of business, thinner profit margin should become the norm going forward.
(e) All these negative factors had more or less been factored in. Share price has caught up with fundamentals. The 40% decline in share price mirros declines in profitability. At current level, PER is approximately 11 times while dividend yield is approximately 4%.
Century Bond Bhd (CBD) Snapshot
|
Open
1.24
|
Previous Close
1.24
|
|
|
Day High
1.24
|
Day Low
1.24
|
|
|
52 Week High
04/9/14 - 1.64
|
52 Week Low
12/15/14 - 1.17
|
|
|
Market Cap
148.8M
|
Average Volume 10 Days
66.4K
|
|
|
EPS TTM
0.11
|
Shares Outstanding
120.0M
|
|
|
EX-Date
12/11/14
|
P/E TM
11.1x
|
|
|
Dividend
0.03
|
Dividend Yield
4.03%
|
Please refer to Appendix 1 below for further details of the group's operations.
The group has strong balance sheets with limited borrowings and RM87.6 mil cash, representing cash of RM0.73 per share.
Consistently profitable throughout the years, even during 2008 and 2009.
Annual Result:
| F.Y. | Revenue ('000) | Profit Attb. to SH ('000) | EPS (Cent) | PE | DPS (Cent) | DY | NAPS | ROE (%) | |
|---|---|---|---|---|---|---|---|---|---|
| TTM | 165,222 | 13,408 | 11.17 | 11.11 | 5.00 | 4.03 | 1.4200 | 7.87 |
|
| 2014-03-31 | 171,183 | 17,140 | 14.28 | 10.72 | 4.00 | 2.61 | 1.3700 | 10.42 |
|
| 2013-03-31 | 186,841 | 19,153 | 15.96 | 5.83 | 5.00 | 5.38 | 1.2600 | 12.67 |
|
| 2012-03-31 | 181,609 | 14,801 | 12.33 | 6.49 | 4.00 | 5.00 | 1.1400 | 10.82 |
|
| 2011-03-31 | 170,494 | 14,928 | 12.44 | 5.47 | - | - | 1.0600 | 11.74 |
|
| 2010-03-31 | 168,215 | 17,741 | 14.78 | 4.34 | - | - | 0.9500 | 15.56 |
|
| 2009-03-31 | 203,211 | 12,078 | 10.06 | 3.38 | - | - | 0.8500 | 11.84 |
|
| 2008-03-31 | 177,946 | 10,455 | 8.71 | 5.75 | - | - | 0.7700 | 11.31 |
|
Share price has been on downward trend from RM2.00 in July 2013 until RM1.24 now.
Earnings in the latest three quarters had disappointed. Did the weak earnings cause the de-rating ? What was the reasons for decline in profitability ?
Quarter Result:
| F.Y. | Quarter | Revenue ('000) | Profit before Tax ('000) | Profit Attb. to SH ('000) | EPS (Cent) | DPS (Cent) | NAPS |
|---|---|---|---|---|---|---|---|
| 2015-03-31 | 2014-09-30 | 38,151 | 4,745 | 3,353 | 2.79 | 3.00 | 1.4200 |
| 2015-03-31 | 2014-06-30 | 42,239 | 4,255 | 2,942 | 2.45 | - | 1.3900 |
| 2014-03-31 | 2014-03-31 | 41,585 | 4,256 | 2,898 | 2.42 | 2.00 | 1.3700 |
| 2014-03-31 | 2013-12-31 | 43,247 | 6,112 | 4,215 | 3.51 | - | 1.3600 |
| 2014-03-31 | 2013-09-30 | 41,410 | 7,334 | 5,057 | 4.21 | 2.00 | 1.3500 |
| 2014-03-31 | 2013-06-30 | 48,370 | 7,066 | 4,970 | 4.14 | - | 1.3000 |
| 2013-03-31 | 2013-03-31 | 44,900 | 7,251 | 5,821 | 4.85 | 3.00 | - |
| 2013-03-31 | 2012-12-31 | 48,347 | 7,064 | 4,771 | 3.98 | 2.00 | 1.2200 |
| 2013-03-31 | 2012-09-30 | 46,407 | 6,163 | 4,149 | 3.46 | - | 1.1900 |
| 2013-03-31 | 2012-06-30 | 47,187 | 6,172 | 4,411 | 3.68 | - | 1.1800 |
| 2012-03-31 | 2012-03-31 | 44,226 | 5,730 | 3,966 | 3.31 | 2.50 | - |
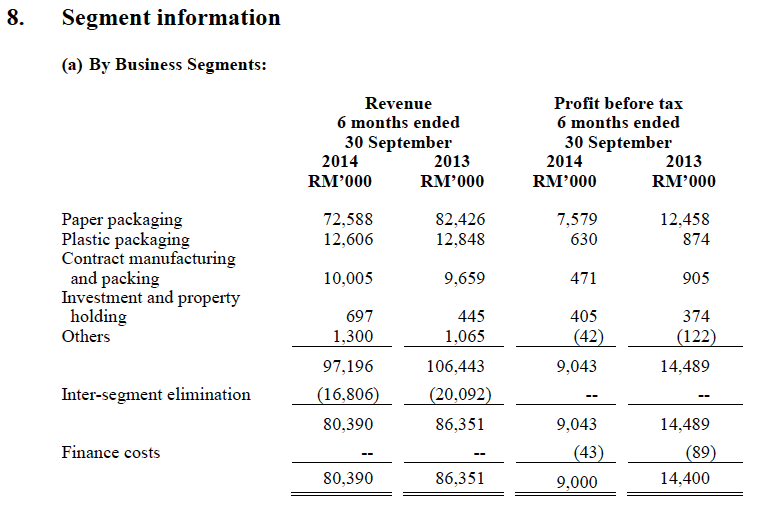
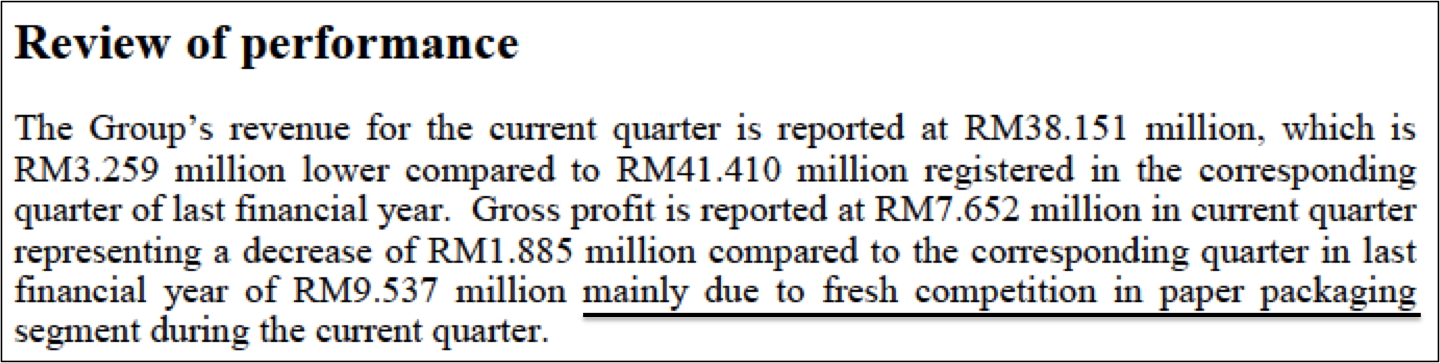
Lower profitability principally due to heightened competition at paper packaging division. This has been the case since March 2014 quarter. The decline in profitability should be structural in nature. Unless there are changes in competitive landscape, future earnings might stay at current level.
Appendix 1 - Group Operations

Related Stocks
| Chart | Stock Name | Last | Change | Volume |
|---|
More articles on Icon8888 Gossips About Stocks
(Icon) Jaks Resources - IRR Model Shows That RM300 mil Net Profit p.a. For 30% Stake Is Plausible
Created by Icon8888 | May 01, 2020
(Icon) Notion VTec - Forget About The Virus, It Is Time To Rock and Roll
Created by Icon8888 | Mar 10, 2020
(Icon) Sam Engineering - Excellent Result. Share Price Can Potentially Double Within 2 Years
Created by Icon8888 | Mar 01, 2020
(Icon) Alliance Bank - One Off Provision Affected Previous Quarter Earning. Time To Buy On Weakness
Created by Icon8888 | Nov 13, 2019
Discussions
Be the first to like this. Showing 0 of 0 comments
Post a Comment
Featured Posts

Apps


Top Articles
1
AmInvest Research Reports
2
TA Sector Research
3
4
save malaysia!
5
6
7
#
Stock
Score
Daily Stocks
Stock Name
Last
Change
Volume
Stock Name
Last
Change
Volume
Featured Advertisers / Partners


Ride The Bull Short The Bear
CS Tan
4.9 / 5.0
This book is the result of the author's many years of experience and observation throughout his 26 years in the stockbroking industry. It was written for general public to learn to invest based on facts and not on fantasies or hearsay....