


Icon8888 Gossips About Stocks
(Icon) Jaycorp (1) - Rubber Wood Furniture Maker. Dividend Yield of 4.8%

Jaycorp Bhd (JAYC) Snapshot
|
Open
0.71
|
Previous Close
0.71
|
|
|
Day High
0.71
|
Day Low
0.71
|
|
|
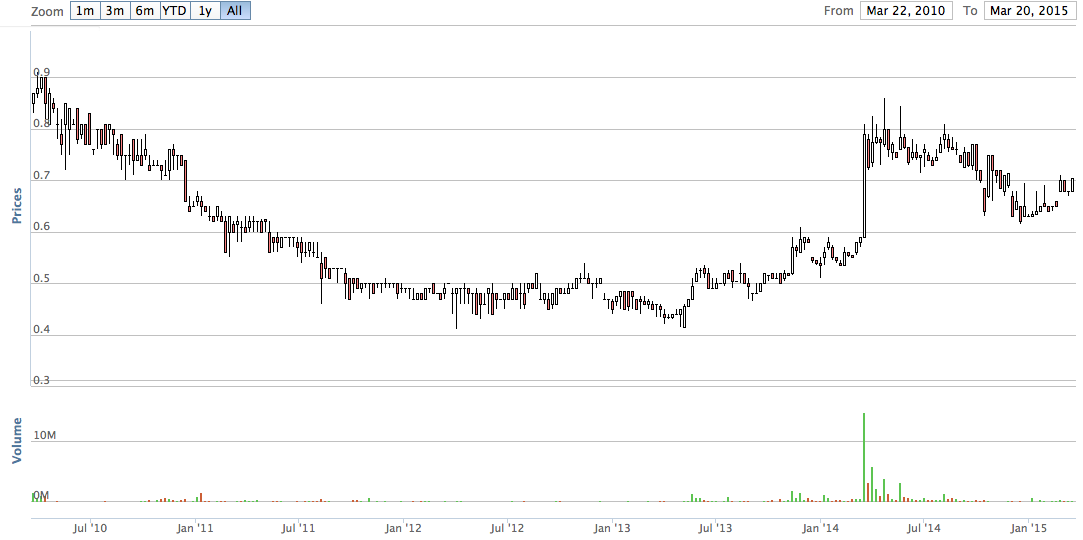
52 Week High
04/23/14 - 0.86
|
52 Week Low
12/17/14 - 0.62
|
|
|
Market Cap
96.4M
|
Average Volume 10 Days
35.9K
|
|
|
EPS TTM
0.06
|
Shares Outstanding
136.8M
|
|
|
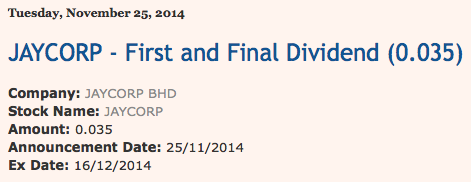
EX-Date
12/16/14
|
P/E TM
12.7x
|
|
|
Dividend
0.04
|
Dividend Yield
4.96%
|
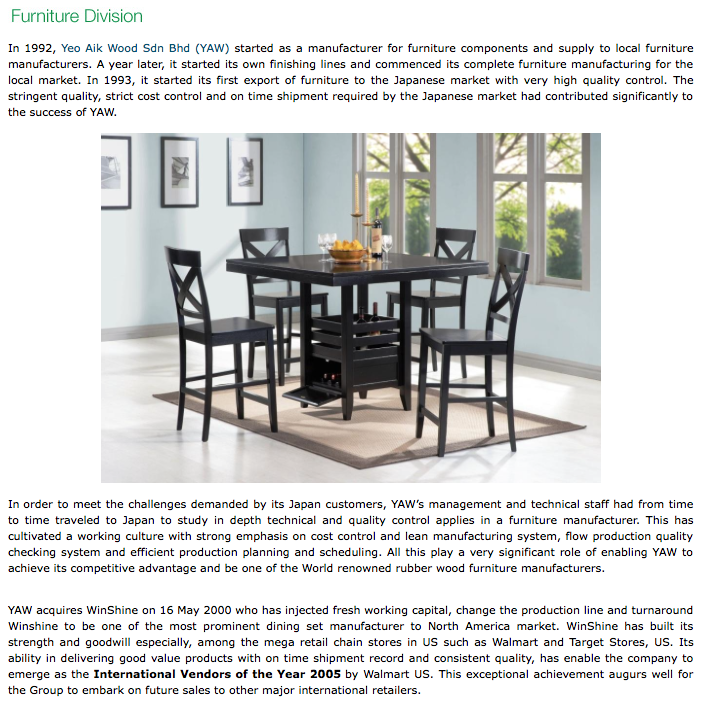
Jaycorp Berhad manufactures and sells rubber wood furniture.
The company operates through four segments: Rubberwood Furniture, Packaging, Processing of Rubberwood, Renewable Energy, and Others.
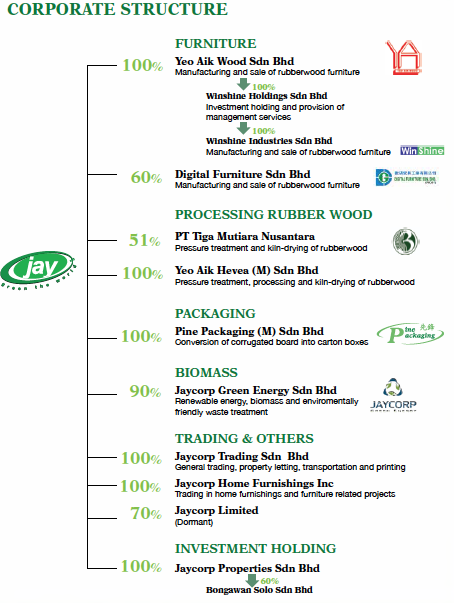
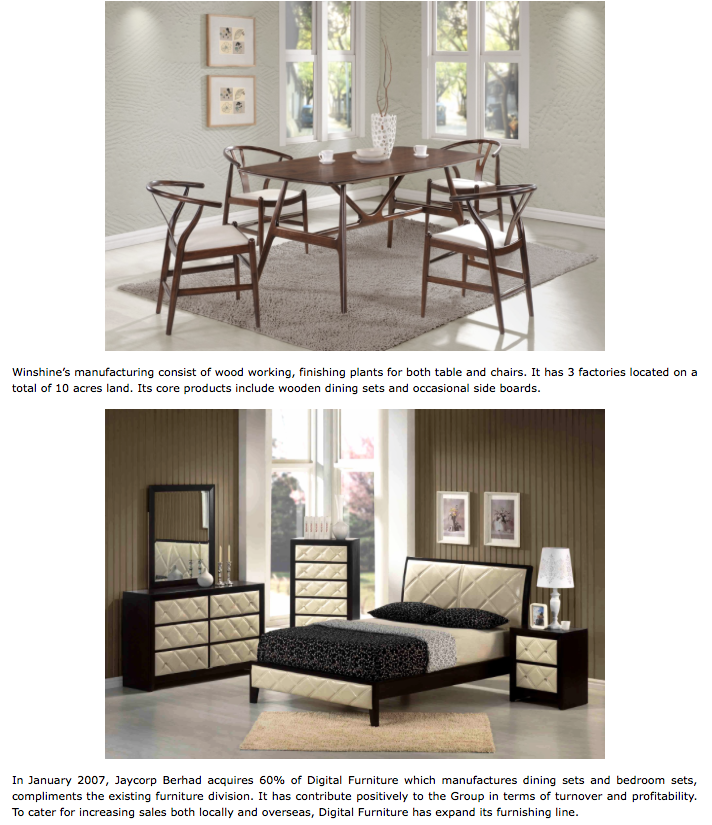
It offers wooden dining sets, bedroom sets, and occasional side boards.
The company is also involved in the conversion of corrugated boards into carton boxes; processing and kiln–drying of rubber wood; etc.
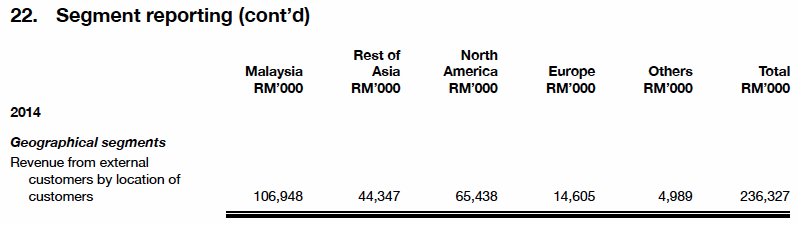
Jaycorp serves various customers primarily in Malaysia and the rest of Asia, as well as North America and Europe.
The company was formerly known as Yeo Aik Resources Berhad and changed its name to Jaycorp Berhad in 2006.
Jaycorp Berhad was founded in 1992 and is based in Kuala Lumpur, Malaysia.
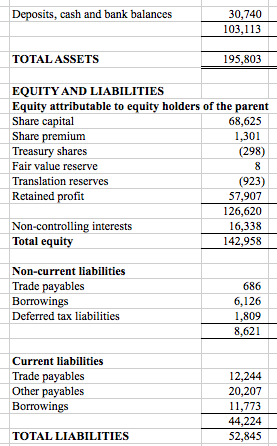
The group has healthy balance sheets with net cash of RM12 mil.
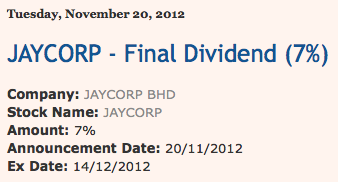
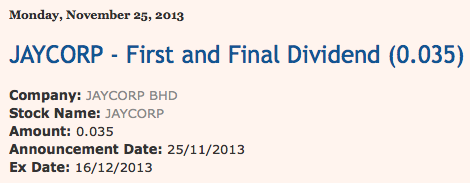
The company paid dividend of 3.5 sen in 2012, 2013 and 2014. Based on 73 sen, dividend yield is 4.8%.
The group has been consistently profitable throughout recent yars.
Annual Result:
| F.Y. | Revenue ('000) | Profit Attb. to SH ('000) | EPS (Cent) | PE | DPS (Cent) | DY | NAPS | ROE (%) |
|---|---|---|---|---|---|---|---|---|
| TTM | 242,849 | 7,515 | 5.54 | 13.00 | 3.50 | 4.86 | 0.9300 | 5.96 |
| 2014-07-31 | 236,327 | 8,625 | 6.31 | 12.37 | 3.50 | 4.49 | 0.9200 | 6.86 |
| 2013-07-31 | 209,281 | 5,086 | 3.72 | 13.58 | 3.50 | 6.93 | 0.8900 | 4.18 |
| 2012-07-31 | 236,612 | 10,261 | 7.50 | 6.27 | 3.50 | 7.45 | 0.8900 | 8.43 |
| 2011-07-31 | 192,059 | 2,548 | 1.86 | 30.11 | 2.00 | 3.57 | 0.8300 | 2.24 |
| 2010-07-31 | 227,414 | 13,924 | 10.41 | 7.40 | 7.50 | 9.74 | 0.8700 | 11.97 |
| 2009-07-31 | 252,657 | 12,297 | 9.48 | 5.28 | 9.00 | 18.00 | 0.8300 | 11.42 |
The group reported net profit of RM1.16 mil for the Q1 of FY2014 (the quarter ended 30 October 2014).
The company will be releasing its second quarter result by end of March 2015.
Quarter Result:
| F.Y. | Quarter | Revenue ('000) | Profit before Tax ('000) | Profit Attb. to SH ('000) | EPS (Cent) | DPS (Cent) | NAPS |
|---|---|---|---|---|---|---|---|
| 2015-07-31 | 2014-10-31 | 64,274 | 3,462 | 1,156 | 0.85 | - | 0.9300 |
| 2014-07-31 | 2014-07-31 | 59,946 | 3,383 | 1,706 | 1.25 | 3.50 | 0.9200 |
| 2014-07-31 | 2014-04-30 | 54,751 | 2,984 | 2,172 | 1.59 | - | 0.9100 |
| 2014-07-31 | 2014-01-31 | 63,878 | 3,615 | 2,481 | 1.85 | - | 0.8900 |
| 2014-07-31 | 2013-10-31 | 57,752 | 3,612 | 2,210 | 1.62 | - | 0.9000 |
| 2013-07-31 | 2013-07-31 | 54,581 | -97 | -1,554 | -1.14 | 3.50 | - |
| 2013-07-31 | 2013-04-30 | 46,464 | 5,265 | 3,621 | 2.65 | - | 0.9000 |
| 2013-07-31 | 2013-01-31 | 54,319 | 3,289 | 2,212 | 1.62 | - | 0.8700 |
| 2013-07-31 | 2012-10-31 | 53,917 | 1,584 | 871 | 0.64 | - | 0.8900 |
| 2012-07-31 | 2012-07-31 | 63,516 | 2,749 | 2,275 | 1.66 | 3.50 | - |
| 2012-07-31 | 2012-04-30 | 62,107 | 6,411 | 3,589 | 2.62 | - | 0.8700 |
| 2012-07-31 | 2012-01-31 | 59,547 | 3,947 | 2,904 | 2.12 | - | 0.8500 |
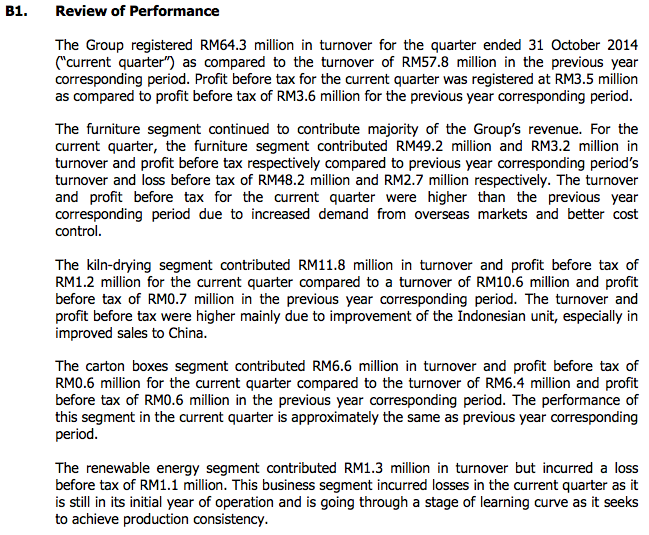
In the October 2014 quarter, furniture making accounted for the bulk of the profit (RM3.2 mil PBT). Processing of rubber wood was the second largest contributor (RM1.22 mil PBT). Losses at renewable energy division dragged down overall group performance (LBT of RM1 mil).
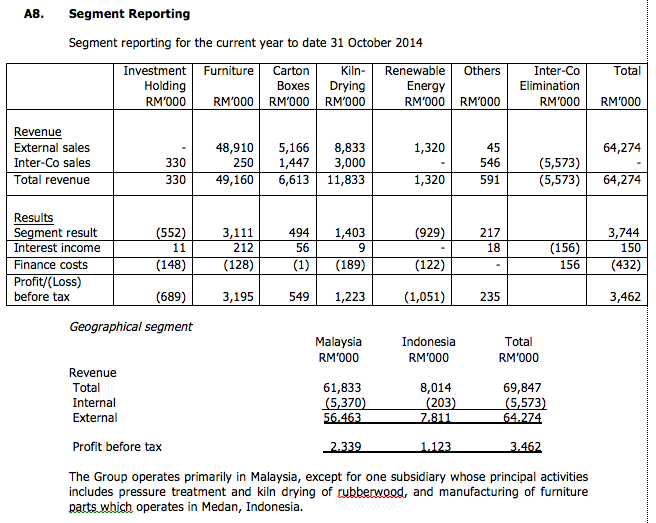
In FY2014, the group exports approximately 55% of its products.
Appendix - The Jaycorp Group
Related Stocks
| Chart | Stock Name | Last | Change | Volume |
|---|
Market Buzz
More articles on Icon8888 Gossips About Stocks
(Icon) Jaks Resources - IRR Model Shows That RM300 mil Net Profit p.a. For 30% Stake Is Plausible
Created by Icon8888 | May 01, 2020
(Icon) Notion VTec - Forget About The Virus, It Is Time To Rock and Roll
Created by Icon8888 | Mar 10, 2020
(Icon) Sam Engineering - Excellent Result. Share Price Can Potentially Double Within 2 Years
Created by Icon8888 | Mar 01, 2020
(Icon) Alliance Bank - One Off Provision Affected Previous Quarter Earning. Time To Buy On Weakness
Created by Icon8888 | Nov 13, 2019
Discussions
Be the first to like this. Showing 9 of 9 comments
tonylim I where got so much time ? Need to work, cook, change diapers, clean toilets, buy groceries, visit old folks home, mow the lawn.....
2015-03-22 10:47
Icon888 . You dont need to do all the cffo or dcf stuff. If we see potential, we will quantify it by ourself. We are not leechers.
Im just demand for a screenshot of cashflow.
2015-03-22 12:34
Please take a look at Note A12 of the latest NOTES TO QUARTERLY REPORT ON CONSOLIDATED RESULT:
Corporate guarantees in favour of bankers for providing banking facilities to subsidiaries: RM113,764,000.00
What does it means? Shouldn't it be an issue of concern?
Looking for a justification. Tq!
2015-03-22 15:28
Page 118 of FY2014 Annual Report states that "the company issued RM113 mil corporate guarantee to financial institutions for credit facilities granted to subsidiaries"
It goes on to state that "the facilities utilised by the subsidiaries as of year end amounted to RM22.5 mil"
My guess is that the bank has given them maximum credit limit of RM113 mil and requires all of them to be corporate guaranteed (a common feature). But the subsidiaries had only used up RM22.5 mil (the group traditionally doesn't rely much on borrowings)
No cause for alarm
2015-03-23 02:20
Post a Comment
Featured Posts
Introducing MY's First IPO Fund for Sophisticated Investors!
New Update. Discover investment communities that resonate with your ideas
M & A Value Partners IPO Equity Fund has been launched - Targeted 13% Return p.a
Latest Videos


MQ Trading Signals
Time
Signal
Duration
Type
2024-07-23 09:30:00
EMA 5
10 Mins
SELL
2024-07-23 09:25:00
EMA 5
5 Mins
SELL
2024-07-23 09:20:00
ADX
10 Mins
SELL
2024-07-23 09:20:00
ADX
5 Mins
SELL
2024-07-23 09:20:00
TURTLE SYSTEM 20
5 Mins
SELL
Apps


Top Articles
1
BFM Podcast
2
Koon Yew Yin's Blog
3
CGS-CIMB Research
Genting Plantations - Proposed Land Acquisition in Indonesia
5
save malaysia!
6
南洋 - 凭单专栏/温世麟
7
Koon Yew Yin's Blog
8
save malaysia!
#
Stock
Score
Daily Stocks
Stock Name
Last
Change
Volume
Stock Name
Last
Change
Volume
Stock Name
Last
Change
Volume
Featured Advertisers / Partners


Ride The Bull Short The Bear
CS Tan
4.9 / 5.0
This book is the result of the author's many years of experience and observation throughout his 26 years in the stockbroking industry. It was written for general public to learn to invest based on facts and not on fantasies or hearsay....
CFTrader
Icon888 Bro, you always lack the most important stuff in these kind of industry.
Cashflow.
At least you print a screenshot of cashflow for us to determine in someway:
1. Was the earning REAL earning ? When I'm saying real, it's Real Hard Cash ?
2. Dividend ... Was that paying from the earning due operation or like Maxis, paying dividend by using debt ? Was the dividend sustainable ? Or the dividend amount is better to repay debt ?
IMHO, we can dig tons of info from cashflow, alone. P&L statement ? to me, that's just bonus =P
2015-03-22 00:24