


Icon8888 Gossips About Stocks
(Icon) MACD (3) - A TA Tool For FA Investors

1. Introduction
Note : To fully understand what I wrote in this article, I suggest you first go through my previous articles about MACD.
http://klse.i3investor.com/blogs/icon8888/96000.jsp
http://klse.i3investor.com/blogs/icon8888/96025.jsp
http://klse.i3investor.com/blogs/icon8888/96526.jsp
Just to recap, MACD generates transaction signals when it crosses either the Sginal Line or Zero Line.
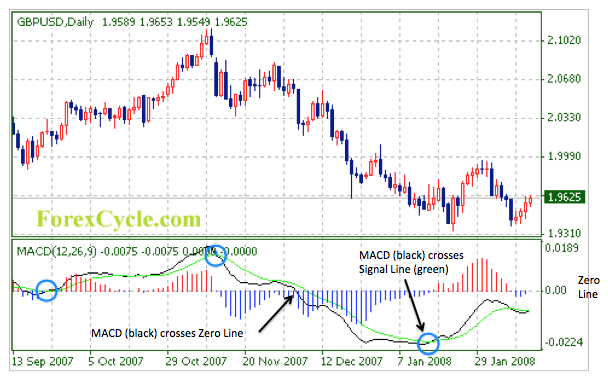
As mentioned in my previous article, Signal Line crossing is more sensitive. It gives more advanced warning compared to Zero Line crossing. However, there will also be more false signals, especially when the stock is trading sideway.
2. Pleasant Surprises From Zero Line Crossing
To test out how MACD will fare in real life trading or investing, I tried it out with some of the stocks that I bought in 2015. The findings turned out to be quite positive.
As expected, Signal Line Crossing is not very useful as it generated too many Buy Sell signals. As shown in diagram below, MACD crossed Signal Line by more than 20 times during the period under review.
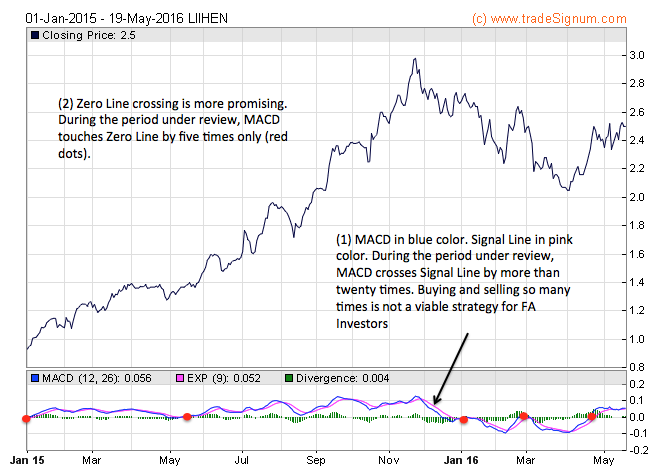
Zero Line Crossing is more promising. However, it still is too sensitive, generated 5 signals during the period.
One possible way to filter out the noises is to wait for a noticeable gap to open up between MACD and Zero Line.
By applying this method, an FA investor would have done well with furniture stocks in 2015 :-
(a) Lii Hen
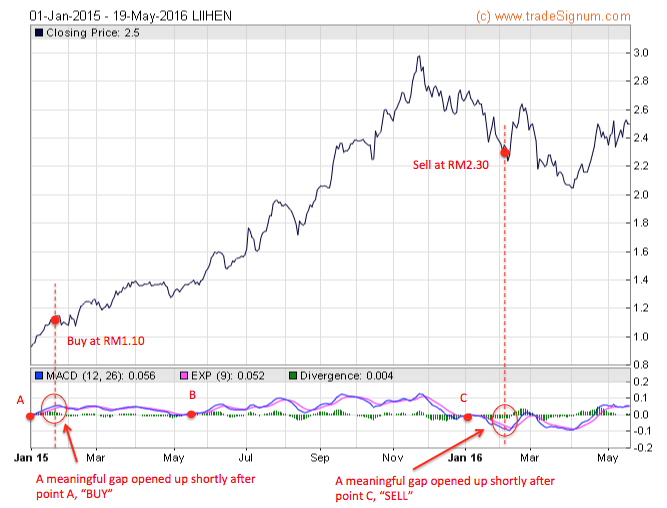
An investor who applied the above method would have bought Lii Hen at RM1.10 and sold at RM2.30. Even though he didn't manage to buy and sell at lowest and highest points respectively, his return is still a commendable 109%.
Please note that if he didn't allow a gap to open up, he would have sold the stock at point B at RM1.40 and missed out the rest of the rally.
(b) Poh Huat
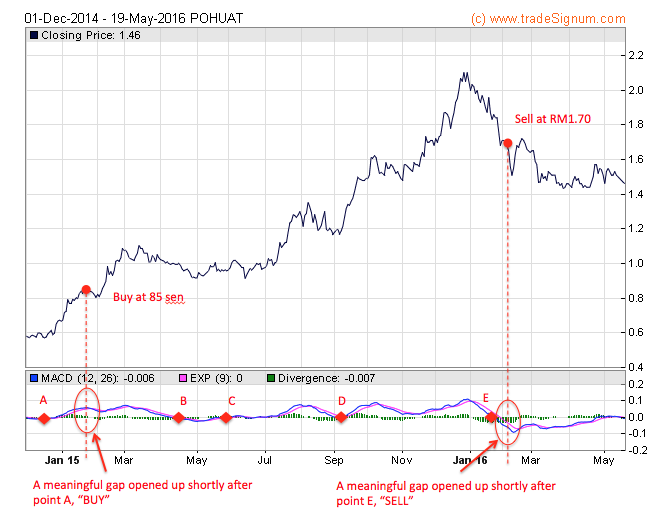
An investor who applied the above method would have bought Poh Huat at RM0.85 and sold at RM1.70. Even though he didn't manage to buy and sell at lowest and highest points respectively, his return is still a commendable 100%.
Please note that if he didn't allow a gap to open up, he would have undertaken additional transactions at point B, C and D. From FA investors' point of view, unnecessary transactions are not a good thing as it requires multiple entry / exit decisions, which are not easy to make.
(c) Hevea
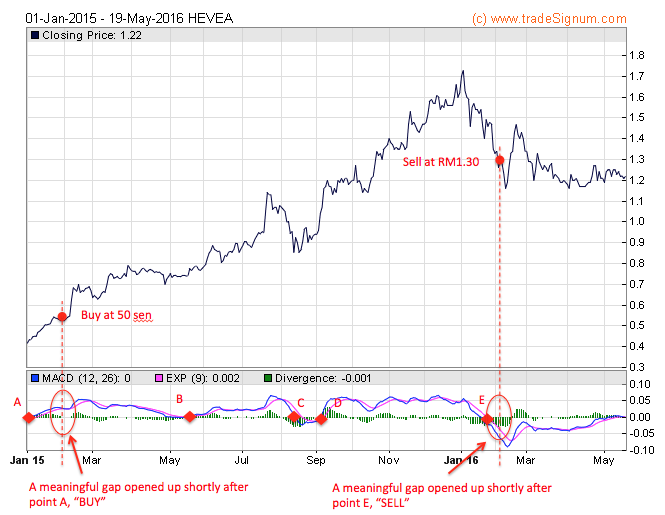
An investor who applied the above method would have bought Hevea at RM0.50 and sold at RM1.30. Even though he didn't manage to buy and sell at lowest and highest points respectively, his return is still a commendable 160%.
Please note that if he didn't allow a gap to open up, he would have undertaken additional transactions at point B, C and D. From FA investors' point of view, unnecessary transactions are not a good thing as it requires multiple entry / exit decisions, which are not easy to make.
(d) Thong Guan
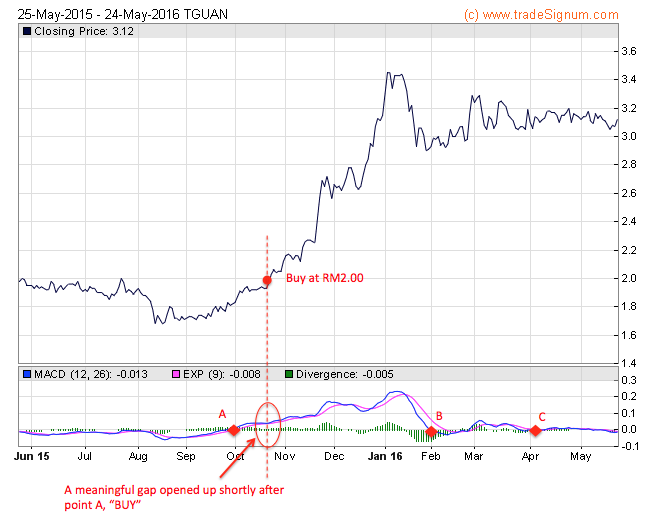
An investor who applied the above method would have bought Thong Guan at RM2.00 at point A. Since his entry, MACD did not touch the Zero Line again until February and April 2016 at point B and C respectively. However, since no meaningful gap opens up at B and C, technically there is no Sell signal yet.
In other words, MACD is telling the Investor to hold on to Thong Guan. On hind sight, this is a correct signal as Thong Guan share price remains stable and did not decline drastically after Point B and C.
3. Does Not Always Work
Wow, it seemed that the method has a 100% success rate !!! Have we found the magic formula that can turn us into Stock Gods ? Not really. Let's look at Berjaya Corp's case, which obviously doesn't work.
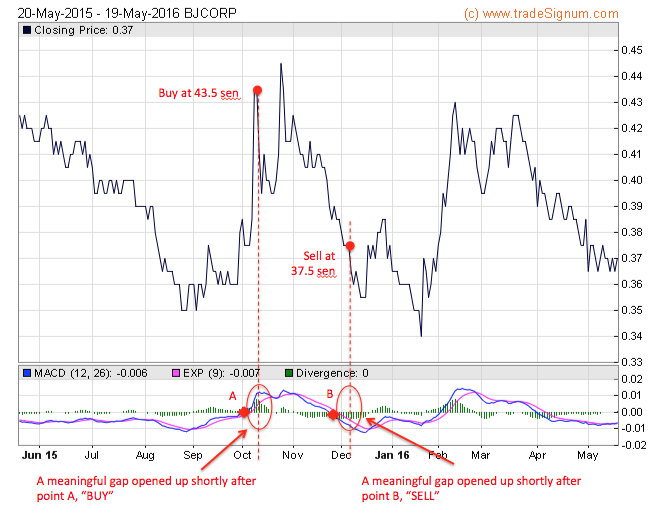
An investor who applied the above method would have bought BJCorp at RM0.435 and sold at RM0.375, incurring a loss of 14%.
Why did the method not work this time ?
4. Strong Trend Required
In my ealier article called "What You Should Know About Technical Indicators", I mentioned that MACD works best when there is a strong trend for the stock :-
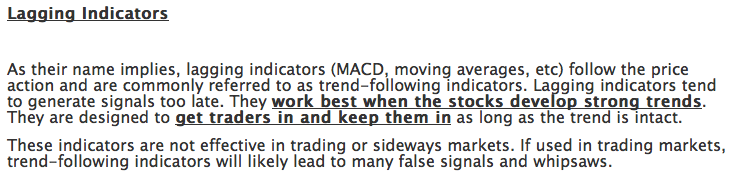
http://klse.i3investor.com/blogs/icon8888/96526.jsp
It is not difficult to prove that MACD is a Lagging Indicator. If you look at Lii Hen's case, the stock peaked at RM3.00 around end Novemer 2015 while MACD only crossed Zero Line in early January 2016 at RM2.70. The same pattern happens to Poh Huat, Hevea and Thong Guan as well.
Because of its inefficiency, MACD only works for stocks that register huge gain (pursuant to a strong trend). MACD is a bit slow prompting you to buy and it is also a bit slow prompting you to sell. As such, certain gain has to be sacrificed. For that to work, there must be sufficient fat between buy and sell.
5. Spotting A Trend Is Easier Said Than Done
In the above section, we establish that MACD only works well for stocks that develope strong trend. But how do you know that a particular stock WILL develope a strong trend ?
If you ask the above question to a TA analyst, he will draw lines all over the Chart to show you how the trend looked like. I have a healthy respect for Technical Analysis, but most of the time I found all these so called Trend detection are 20 / 20 Hindsight. It is easy to describe a trend AFTER it has happened. But detecting a Trend AT ITS INFANCY is a different thing. Sometime you are right, sometime you are wrong.
If that is the case, how do you detect a trend ?
I suggest we fall back on Fundamental Analysis.
For example : By mid 2015, there are indications that Ringgit is about to weaken substantially. There is a possibility of an Export Trend. Zoom in on export stocks and study their MACDs (in this case, Zero Line Crossing).
Another example : Due to a multitude of positive factors, Air Asia is expected to do well in the next 6 to 12 months. I think it is safe for us to say that Air Asia is in an Upward Trend.
Of course, FA is only my suggestion. If you truly feel that your TA methods are reliable enough to allow you to detect Trend at infancy, by all means stick to those methods.
6. Concluding Remarks
(a) My study showed that MACD Zero Line Crossing could be a useful TA tool for FA Investors to buy into a stock, hold it for certain period of time, and exit when Sell signal emerges.
(b) However, MACD is relatively slow in generating Buy or Sell signals. It only prompt you to buy after the stock has gone up by quite a fair bit (as it needs that to confirm the Buy momentum), and the same is true for selling.
(c) Because of the above, MACD Zero Line Crossing only works well for stocks that pose strong gain. In other words, stocks that develope a strong trend. It is not suitable for short term trading that give you let's say, 5% or 10% gain for each trade.
(d) To detect whether a stock will be forming a trend (and hence is suitable for using MACD Zero Line Crossing to guide future Buy Sell decisions), I suggest we rely on Fundamental Analysis to provide guidance. Of course you can use other methods, if you think they work well.
(e) Last but not least, let me highlight one very important point, just in case you didn't notice - The method I propose in this article requires you to identify the stocks that you want to buy (through FA ?). MACD is not supposed to identify the stocks for you. MACD's role is to provide you guidance on entry and exit points.
More articles on Icon8888 Gossips About Stocks
(Icon) Jaks Resources - IRR Model Shows That RM300 mil Net Profit p.a. For 30% Stake Is Plausible
Created by Icon8888 | May 01, 2020
(Icon) Notion VTec - Forget About The Virus, It Is Time To Rock and Roll
Created by Icon8888 | Mar 10, 2020
(Icon) Sam Engineering - Excellent Result. Share Price Can Potentially Double Within 2 Years
Created by Icon8888 | Mar 01, 2020
(Icon) Alliance Bank - One Off Provision Affected Previous Quarter Earning. Time To Buy On Weakness
Created by Icon8888 | Nov 13, 2019
Discussions
4 people like this. Showing 45 of 45 comments
Icon8888, sifu are the most genuine mentor in sharing his best knowledge.
Very few peoples want to do it .
Sincerely thanks for sifu icon8888 kindness.
2016-05-31 14:02
Icon, good research.
MACD does generate false signal, such too early and too late. So, be careful. If you want to use and depend on the MACD, use it with these indicators
Bollinger Band, bb%, Bollinger Band width, Stochastic, MFI, and Wm%R
Just my point of view.
All the best to you.
2016-05-31 14:20
okok , icon8888 bro.
What i talk , no bluffing one.
(only straight and rite things)
2016-05-31 14:21
Icon, period is not constant and subject change according to the volatility of that share counter that you are analyzing. Tuning the period to find the appropriate crossing that match that share counter.
2016-05-31 14:24
Wm%R are highly sensitive for Short Term,
For longer term ,i prefer using a slow Stochastic.
2016-05-31 14:25
Short Term does give a hint whether the medium to long term get screwed or not.
2016-05-31 14:30
Uncle Warren uses all TA, FA n d most difficult one is BA~Business Analyst. BA is to find d most durable competitive advantage or wz wide moat company n invest it long term or more than 10 years. He spend most of his time reading n learning d wide range of businesses, economics, politics n anythings than can make him earn $. If he don't fully understand d business, he don't buy n keep for a single minute. Gd luck!
2016-05-31 14:37
@ kooBee
Commcorp has always in my wacth list.
Need viagra for short term
Long Term , if everything pan out as plan another
EXPLOSIVE COUNTER ON MAKING.
2016-05-31 14:38
VenFx, my TA, so so only. My target of using TA is to find the peak before it drops like sh!!!t and bottom before I curse myself for not getting in earlier.
I made lots of mistake in my TA, still I am just another beginner.
2016-05-31 14:46
I believe , we will only can master TA well through practising it.
No doubt, (nomanland) must has been practising TA intensively.
2016-05-31 14:48
VenFx, yes, practice. But..... don't over depend on or devote to an indicator or oscillator. It might bring you to Amsterdam for holiday. ;)
Always combine.
2016-05-31 15:05
VenFx, I am not against FA.
Example: look at AWC and IFCAMSC.
AWC, FA = Good, TA = sorry for those trap at high price, distribution start on 18 May 2016 and still continuing.
IFCAMC, FA = Just average, TA= gone case since middle of March 2016, collapsed at the end of April 2016
Just my humble opinion.
2016-05-31 15:19
FA,
1st. Public Bank
2nd. Sunway
3rd. high valued stock
Any price below 1, easily for pump and dump.
High priced, not that easy unless someone wants to take over.
Have a good day folks.
p/s: ICON8888, I am sorry for hijacking your article. Cheers, bro.
2016-05-31 15:36
Icon8888, if you have the time, learn these
Bollinger Band, bb%, Bollinger Band width, Stochastic, MFI, and Wm%R
and also learn how to overlay Bollinger Band on top of the indicator or oscillator. Clear direction.
Good day and invest wisely.
2016-05-31 15:58
I am going through all the TA tools
Learning them one by one and back testing them to cerify their usefulness
2016-05-31 16:24
Icon8888, good article sharing for newbie like me to learn. Looking forward for your coming TA tools articles.
2016-06-01 11:33
Icon8888, what about PE ratio? True that if over 10 not so attractive to invest?
2016-06-01 11:34
Icon8888, I just dropped by, before I forget.
Fibonacci retracement. Fibonacci is important for TA, don't ignore it.
Fibonacci's number, human sentiments and mother nature work closely.
Think about it. Cheers
2016-06-01 14:53
Icon8888, just in case you start losing your hairs when TA'ing and thinking, reading too much, blame mother nature or your gene. :)
Good day to you.
2016-06-01 14:57
Another TA, "Ichimoku Kinko Hyo" is one of the TA tool I use frequently. You may want to learn that.
2016-06-01 15:04
Many investors and traders,especially FA, have doubt on the TA. By combining TA and FA, the chances of not getting stuck at the high peak price is there. And the chances of getting in at earlier stage before "Houston, we have lift off"
Remember this, what ever tools TA or FA, investors or traders use,
"Greed always kill the profit."
Most of the time, "Greed murders the profit."
Have a good day to you, folks!
2016-06-01 15:12
My experience with TA so far positive. I spotted homeritz last week at 89 sen by using MACD crossover, today it is up. (My critics, Please don't accuse me of cannon behind horse, I am just chit chatting with nomanland).
Will check out ichimoku
2016-06-01 17:23
Fibonacci? Its like saying tomorow may rain in malysia.
Sometimes u r right.
Too outdate liao la u ppls. Go cc thread n see thise fibonacci sothai all holland liao.
2016-06-01 19:53
Icon8888, while you are learning TA, learn the "Bull trap" and "Bear trap" meaning.
2016-06-01 22:17
Icon8888, homeritz, good for you. Add Bollinger band + Stochastic. Learn when to get out. When price start crossing down from the Bollinger top band to mid band, be careful....
Another point, "spike", real or fake within the Bollinger... another way of saying "bull or bear trap"
I got trapped few times. :(
Refer to other indicators or oscillators for confirmation of exit or entry.
Have a good evening to you, Cheers!
p/s: It is good to share knowledge and feel good of being humble, instead being egotistical person.
2016-06-01 22:33
Icon8888, please! Me, no "sifu"! Just a normal human being trying to share knowledge.
2016-06-01 22:35
Icon888. Slow slow learn hor. It takes 20 yrs to master TA. Wakakaka. Your sifu otb after 20 yrs still HA . Holland Analysis.
Laughdieme liao.
2016-06-01 22:42
Post a Comment
Featured Posts


Apps


Top Articles
1
AmInvest Research Reports
2
TA Sector Research
3
4
save malaysia!
5
6
7
#
Stock
Score
Daily Stocks
Stock Name
Last
Change
Volume
Stock Name
Last
Change
Volume
MQ Trading Signals
Stock
Time
Signal
Duration
Stock
Time
Signal
Duration
Featured Advertisers / Partners


Ride The Bull Short The Bear
CS Tan
4.9 / 5.0
This book is the result of the author's many years of experience and observation throughout his 26 years in the stockbroking industry. It was written for general public to learn to invest based on facts and not on fantasies or hearsay....
Grace Ly
icon, there is no other method better than chartnexus meh?looks like at this moment everyone believe this is super, but believe there are other method measure is it??? i don know yet,,,do u have any idea?
2016-05-31 13:10