


KLCI waves
KLCI waves 13

hotstock1975
Publish date: Mon, 29 Jun 2020, 12:56 AM
hotstock1975
0 101
Elliot wave analysis to measure price behavior for projecting next price actions
Weekly Time Frame
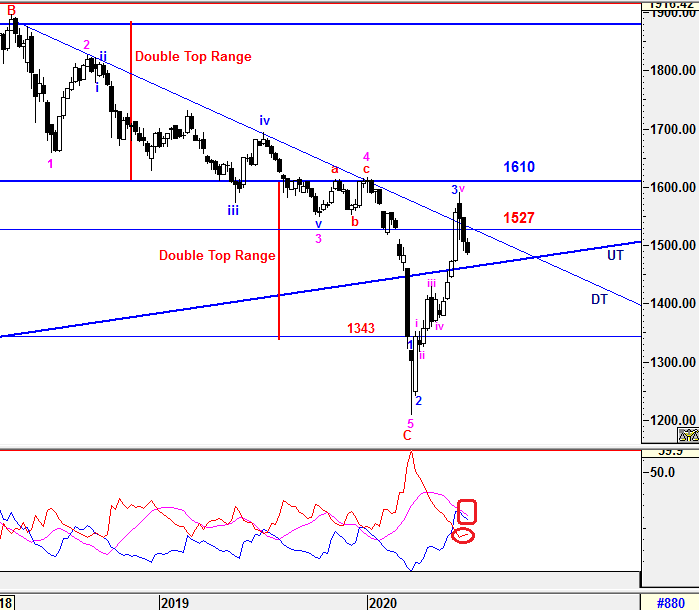
After broken down below DT line and critical support at 1527 last week, an narrowed selling pressure had continue with lower volume and broke below 1490.44. Therefore, UT line will become the critical level to watch now.
As expected, ABC correction waves is still underway which will be elaborated further in daily time frame.
-DMI (red line) & +DMI (blue line) are still curved up and curved down marginally narrow respectively indicates bullish momentum is still decreasing. Besides that, ADX (pink line) is still heading down implying decreasing in volatility indicates market strenght is still weak to initiate a stronger magnitude for a new trend. As mentioned, It would hover around before a new trend to be taken placed.
Prevailing trend could be emerged if levels listed below was broken:
Resistance - 1528
Support - 1473
Critical Support - 1465 (UT line)
Daily Time Frame
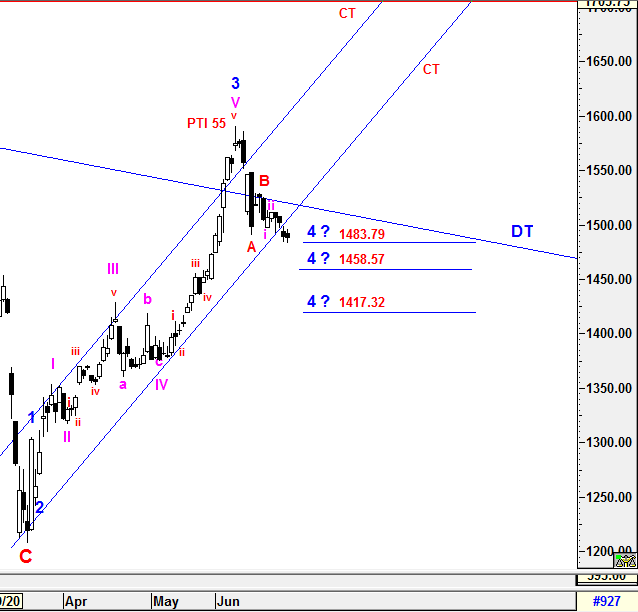
To recap from prior session (KLCI waves 12 - update), the tendency for Wave C construction is very high after 1490.44 was broken which qualifying senario (2) mentioned in prior session (KLCI waves 12). Moreover, lower CT line had been broken and KLCI had been traded below lower CT line indicating possible weaknesses ahead although tweezer bottom formation was formed. Therefore, these CT line will act as an resistance to any bounce up action.
Although the minimum projected target of Wave C has met at 1483.05, Wave C has yet to be realized as the current entire ABC correction structure could be an Zig Zag formation (5-3-5) and it currently still forming the final 5 minor legs (5 sub minutte waves-i-ii-iii-iv-v) down to complete Wave C at lower level at around projected target 1458.57 or 1417.32 . To be more details, sub minutte wave i & ii has been realized and sub minutte wave iii is underway with an iii sub minutte waves extension possible which could be identified in smaller time frame.
To reiterate, the higher degree of 4th wave correction will be completed when Wave C end if there is no complex wave X formation along the waves construction. Besides that, the current PTI reading (55) is still showing positive indication that the current magnitude correcton is healthy enough to succeed the next higher degree of 5th wave after higher degree of 4th wave end.
The entire correction waves would still be monitored closely to anticipate any possible complex wave form structure being emerged. All waves' count and projected target are generated based on past/current price level and it may be subjected to vary if degree of momentum movement has changed.
Prevailing trend could be emerged if levels listed below was broken:
3rd resistance - 1528
2nd resistance - 1511 (CT line)
Immediate resistance - 1498
Immediate support - 1480
2nd support - 1473
3rd Critical Support - 1465 (UT line)
As we aware that short selling mechanism has been extended again till December 2020. Would these be another cushioning effect in coming days or weeks or months?
Let's Mr Market pave the Waves.
Trade safely
Wave Believer
More articles on KLCI waves
KLCI waves 94 - WILL THE DOWNWARD PRESSURE TO BE IMPULSIVE TOWARDS WAVE E?
Created by hotstock1975 | Jan 24, 2022
KLCI waves 93 - EXTENSION UPWARD ENDED AND IT'S TIME TO THE DOWNSIDE?
Created by hotstock1975 | Jan 17, 2022
KLCI waves 89 - KLCI WILL EXTEND AND HIT LOWER TARGETS GRADUALLY
Created by hotstock1975 | Dec 20, 2021
Discussions
Be the first to like this. Showing 0 of 0 comments
Post a Comment
Featured Posts
Introducing MY's First IPO Fund for Sophisticated Investors!
New Update. Discover investment communities that resonate with your ideas
M & A Value Partners IPO Equity Fund has been launched - Targeted 13% Return p.a
Latest Videos


Apps


Top Articles
1
Axcapital's investment blog
KAB - Executing its way to a record quarter. Could more Petronas contracts be coming?
3
4
Koon Yew Yin's Blog
6
BFM Podcast
7
Koon Yew Yin's Blog
CPO price is rising rapidly as shown by chart below - Koon Yew Yin
8
#
Stock
Score
Daily Stocks
Stock Name
Last
Change
Volume
Stock Name
Last
Change
Volume
Stock Name
Last
Change
Volume
MQ Trading Signals
Stock
Time
Signal
Duration
Stock
Time
Signal
Duration
Featured Advertisers / Partners


Ride The Bull Short The Bear
CS Tan
4.9 / 5.0
This book is the result of the author's many years of experience and observation throughout his 26 years in the stockbroking industry. It was written for general public to learn to invest based on facts and not on fantasies or hearsay....