


KLCI waves
KLCI waves 26 - Wave 3 could have started

hotstock1975
Publish date: Mon, 28 Sep 2020, 02:35 AM
hotstock1975
0 101
Elliot wave analysis to measure price behavior for projecting next price actions
Weekly Time Frame
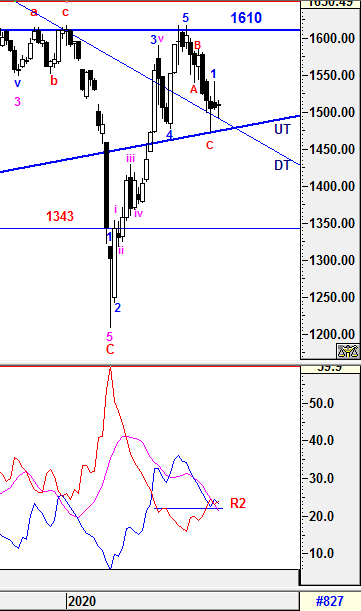
Indeed, KLCI was still unable to close above 1515 which was the level favouring on possible trend reversal and still is the level to watch for confirmation trend reversal on the upside. No doubt that DT and UT line could still playing an important role as a critical supports to initiate any possible upward momentum from now. As expected, an narrow consolidation in between 1490 - 1515 had emerged for the past few days due to some knee jerk reaction. Therefore, caution is still remained until further signal to justify any potential of trend reversal. Once it closed above 1515 convincingly on this coming Friday, trend reversal would be emerged.
On other hand, the Higher Degree of Wave counts will be elaborated further in daily time frame.
1) -DMI (red line) reversed up indicates bearish momentum is increasing and it require penetrating below support at point R2 for signalling bear trend weakening.
2) +DMI (blue line) reversed down indicates bull strenght is weakening.
3) ADX (pink line) is still curving down with greater margin which implying the volatility of the current trend is still low with uncertain and weak.
Therefore, the summations of the 3 signals above is implying uncertainty still remains and knee jerk reaction is unavoidable. From current situaton, +DMI and -DMI had made a narrow criss-cross again with +DMI crossed down below -DMI which indicate a prominent trend has not been developed yet. Besides that, ADX is still indicating weakness in volitality of the current momentum unless ADX start to curve up.
Prevailing trend could be emerged if levels listed below was broken:
Resistance - 1610
Immediate Resistance - 1515, 1525, 1545
Immediate Support - revised to 1488 (DT line)
Support - revised to 1477 (UT line)
Daily Time Frame
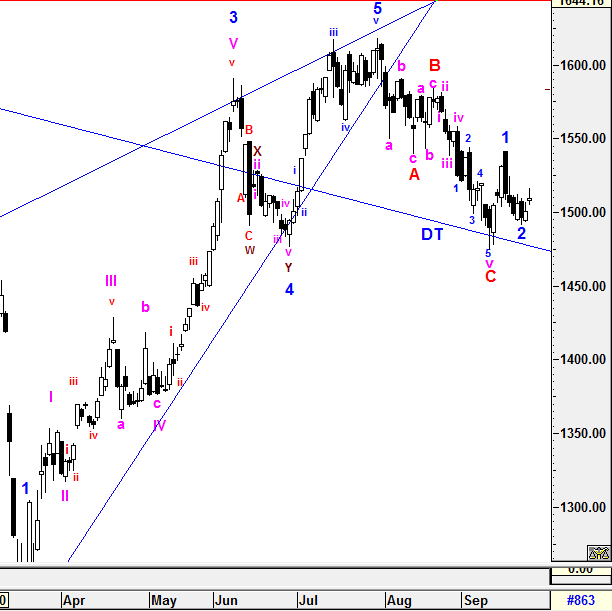
To recap, the Dark Cloud Cover candle formation has indeed intiated some selling pressure for few days and created an narrow range bound of 1495-1510.
On wave counts perspective, Wave 2 would have completed at 1491.17 which qualified the minimum criteria of FIBO 76.4% retracement (1490). To be detail, Wave 2 was formed with minuttes waves of abc(w)-(x)-i-ii-iii-iv-v (y) complex waves formation. Therefore, Wave 3 would have started but it require confirmation of validatity if KLCI manage to close above Wave 1 at 1541.14 convincingly. If Wave 3 is validated, the possible Wave 3 target would be 1558 or 1600. To recap, Wave 3 could be the most implusive waves among the 5 bull waves.
On the other hand, the prior Higher Degree of Correction Waves will be revised If the prior low of wave C (1474.23) breached. Therefore, the entire wave structure will still be monitored closely as complexity wave formations could be emerged such as WXY correction waves may take place before Higher Degree of 5 Waves Bull Run.
All waves' count and projected target are generated based on past/current price level and it may be subjected to vary if degree of momentum movement change.
Prevailing trend could be emerged if levels listed below was broken:
Resistance - 1610
Immediate resistance - 1510, 1515, 1531
Immediate Support - 1495, revised to 1488 (DT line)
Support - revised to 1477 (UT line)
==========================================================================
Let's see how the SUPER CYCLE Bull Run is taking place?
==========================================================================
Let's Mr Market pave the waves.
Trade safely
Wave Believer
More articles on KLCI waves
KLCI waves 94 - WILL THE DOWNWARD PRESSURE TO BE IMPULSIVE TOWARDS WAVE E?
Created by hotstock1975 | Jan 24, 2022
KLCI waves 93 - EXTENSION UPWARD ENDED AND IT'S TIME TO THE DOWNSIDE?
Created by hotstock1975 | Jan 17, 2022
KLCI waves 89 - KLCI WILL EXTEND AND HIT LOWER TARGETS GRADUALLY
Created by hotstock1975 | Dec 20, 2021
Featured Posts


Latest Videos


Apps


Top Articles
1
Axcapital's investment blog
KAB - Executing its way to a record quarter. Could more Petronas contracts be coming?
3
4
Koon Yew Yin's Blog
6
BFM Podcast
7
Koon Yew Yin's Blog
CPO price is rising rapidly as shown by chart below - Koon Yew Yin
8
#
Stock
Score
Daily Stocks
Stock Name
Last
Change
Volume
Stock Name
Last
Change
Volume
Stock Name
Last
Change
Volume
MQ Trading Signals
Stock
Time
Signal
Duration
Stock
Time
Signal
Duration
Featured Advertisers / Partners


Ride The Bull Short The Bear
CS Tan
4.9 / 5.0
This book is the result of the author's many years of experience and observation throughout his 26 years in the stockbroking industry. It was written for general public to learn to invest based on facts and not on fantasies or hearsay....