


KLCI waves
KLCI waves 61 - KLCI To Consolidate Before Breakout ?

hotstock1975
Publish date: Sun, 06 Jun 2021, 12:48 AM
hotstock1975
0 101
Elliot wave analysis to measure price behavior for projecting next price actions
Monthly Time Frame
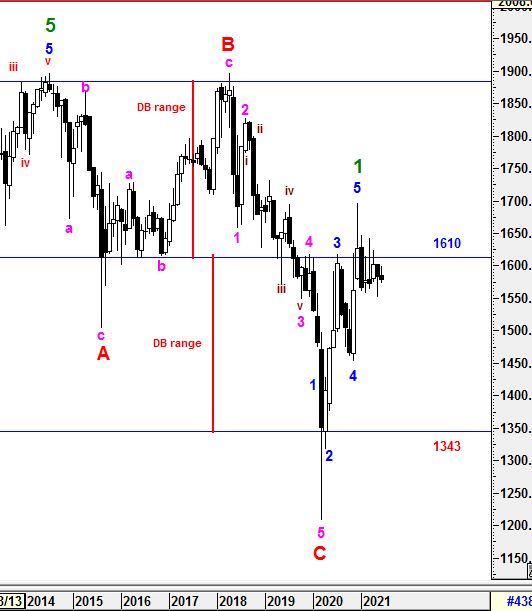
To recap from session 56, KLCI had able to close above 1566.4 without validation of Bearish Engulfing Formation and consolidated within the range of black candle of the Engulfing Formation 1566.4 - 1629. However, it still failed to close above 1610 to regain the momentum to the upside and overwrite the Double Top Formation (DB range) for long run.
{{{{{{{{{{{{{{{{{{{{{{{{{{
For the past 1 months, KLCI had moved in a tight range and still consolidating within Engulfing Formation 1566.4 - 1629. No doubt that we will still prefer KLCI would sustain good closing above 1610 for coming few months in order to setup a stronger foothold to the upside for longer run.
}}}}}}}}}}}}}}}}}}}}}}}}}}
On wave counts perspective, Primary Wave 1 could be formed after 5 Higher Degree of Impulsive Waves had been structured from March to Dec 2020. No doubt that Primary Wave 2 correction is underway which expected to be a prolong waves unless a unknown catalyst emerged to re-write the extension waves within. Therefore, smaller time frame would be monitor closely for any unexpected waves incurred. Subsequent minor waves would be elaborated further in daily time frame.
To reiterate, the Double Top Formation (DB range) structure formed in between July 2014 and April 2018 could be overwritten by Primary Wave 3 Bull Run when Primary Wave 2 Correction end.
The new Super Cycle Bull Wave is still valid and expecting some knee jerk reactions along the prolong cycle.
Prevailing trend could be emerged if Monthly levels listed below was broken:
Resistance : 1610
Support : 1573, 1566, 1525-1530, 1500, 1465
Weekly Time Frame
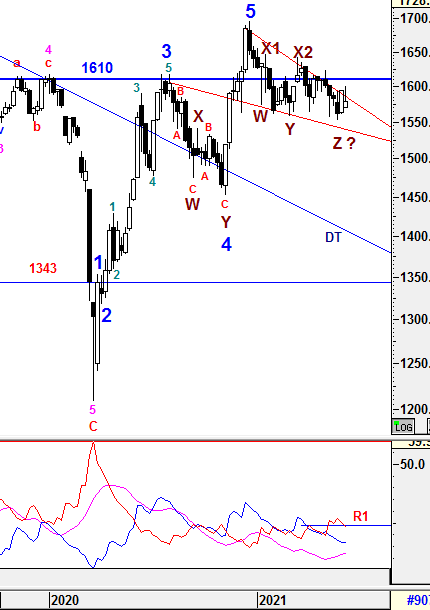
To recap from prior session 60, an Falling Wedge Pattern (red band) has been structered which indicated an continouos trend could soon be initiated if breakout emerged either side. The bullish pattern would be validated if KLCI could close above 1610 for weeks convincingly in order to justify an formidable trend to the upside for longer run.
{{{{{{{{{{{{{{{{{{{{{{{{{{
For the past 1 week, breakout was attempted but retraced back below the upper Wedge Pattern (upper red line band). Therefore, a short term consolidation required within the Wedge's band before a true breakout emerged. However, 1610 is still the level to watch for longer run.
}}}}}}}}}}}}}}}}}}}}}}}}}}
From wave count perspective, the Higher Degree of Correction wave would be prolong with Multiple WXYXZ complex waves before a new set of Higher Degree of Bull Wave take place. Subsequent minor waves would be elaborated further in daily time frame.
1) -DMI (red line) still heading down with consistent margin indicates bear strenght is decreasing consistently and crossed below R1 indicates bearish sentiment could be reduced further for a week.
2) +DMI (blue line) still heading down with reducing margin indicates bull strenght is decreasing with lower pace and could return in favor in short run.
3) ADX (pink line) still heading up with consistent margin implying that the volatility of the current trend is still increasing but still low.
Therefore, the summations of the 3 signals above is still implying Bear strength is still in favor. However, +DMI is still below -DMI lines with decreasing spread which indicating the Bear strength is still in favor but lower pace with consistent volitality. This indicates that weakness may still emerging and consolidating expected in coming weeks. The current volatility is improving but still low and continuous rise in ADX reading would justify a prominent uptrend to be developed.
Prevailing trend could be emerged if Weekly levels listed below was broken:
Resistance - 1627, 1633, 1642, 1650, 1700, 1720
Immediate Resistance - 1585, 1588, 1595, 1600, 1610, 1615, 1619
Immediate Support - 1575-1577, 1570, 1564
Support - 1556, 1541, 1530, 1510, 1500
Daily Time Frame
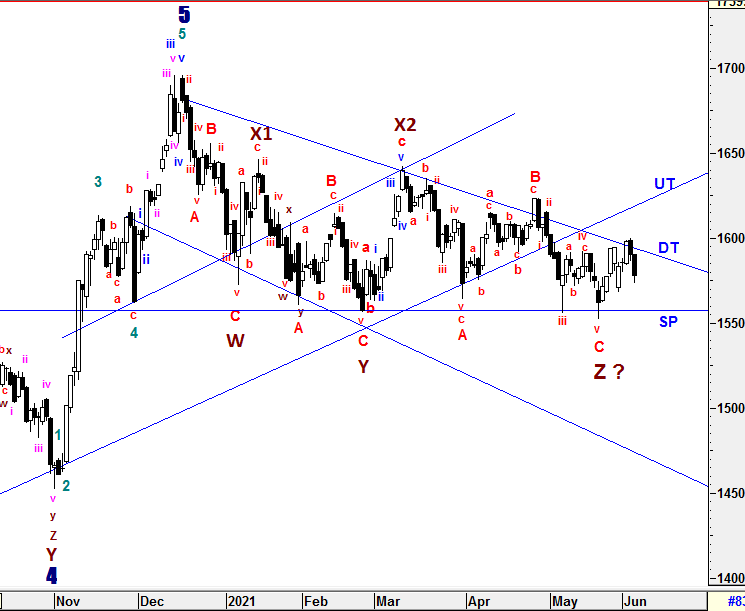
To recap from session 60, the entire wave ABC structure from X2 had been formed as 3-3-5 FLAT Formation structure. However, i was still monitoring closely whether Wave Z could have ended at this point too as i was still leaving some room for Wave Z to be justified by a strong clearer signal if KLCI could penetrade both DT and UT line convincingly. Since DT and UT line have yet to be penetraded, i won't rule out that there could be more Complex Waves formations if the current rebound was shortlive.
{{{{{{{{{{{{{{{{{{{{{{{{{{
For the past 1 week, KLCI retraced below DT line after DT line was tested. Even the rebound was shortlive as expected, i am still monitoring and not conclude that Complex Waves has emerged. Since DT and UT line have yet to be penetraded, the target of Wave Z is still being monitored closely. On the other hand, the lower level to watch is 1568.47 which would decide the current correction would be prolong at least for shorter term if it breached. If the breached emerged, the SP line support level (1557) would be threaten to be breached. Above all, i am expecting a short term consolidation emerged before a clear signal being seen.
}}}}}}}}}}}}}}}}}}}}}}}}}}
To reiterate, Wave Z could be formed in various correctives wave structure (Zig-Zag, Flat, Diagonal and etc) with momentum changes.
Since Multiple Complex Wave emerged, the new set of Higher Degree of 5 Waves Bull Run or Primary Wave 3 have yet to be seen until all corrective waves are served convicingly. Thus, Higher Degree of Correction is still being prolong by these Multiple Complex Waves WXYXZ.
The entire wave structures will still be monitored closely if the high of Wave X1 (1646.24) is penetraded which indicates Higher Degree of implusive Wave 1 could have emerged.
All waves' count and projected target are generated based on past/current price level and it may be subjected to vary if degree of momentum movement change.
Prevailing trend could be emerged if Daily levels listed below was broken:
Resistance - 1615, 1620, 1625-1628, 1639, 1645, 1650, 1662, 1679, 1685, 1700, 1720
Immediate resistance - 1583, 1590, 1595-1597, 1600, 1608-1610
Immediate Support - 1578, 1570, 1562-63, 1556-1551, 1538-1545
Support - 1530, 1518, 1500
==================================================================================
Patient is required for the SUPER CYCLE Bull Run.
==================================================================================
Let's Mr Market pave the waves.
Trade safely
Wave Believer
More articles on KLCI waves
KLCI waves 94 - WILL THE DOWNWARD PRESSURE TO BE IMPULSIVE TOWARDS WAVE E?
Created by hotstock1975 | Jan 24, 2022
KLCI waves 93 - EXTENSION UPWARD ENDED AND IT'S TIME TO THE DOWNSIDE?
Created by hotstock1975 | Jan 17, 2022
KLCI waves 89 - KLCI WILL EXTEND AND HIT LOWER TARGETS GRADUALLY
Created by hotstock1975 | Dec 20, 2021
Discussions
Be the first to like this. Showing 0 of 0 comments
Post a Comment
Featured Posts
Introducing MY's First IPO Fund for Sophisticated Investors!
New Update. Discover investment communities that resonate with your ideas
M & A Value Partners IPO Equity Fund has been launched - Targeted 13% Return p.a
Latest Videos
.png)
.png)


Apps


Top Articles
1
2
save malaysia!
3
save malaysia!
4
Good Articles to Share
5
Good Articles to Share
6
The Alpha Trader
KINERGY ADVANCEMENT BERHAD) (0193) - A CAPITULATION TRADE SETUP
7
Good Articles to Share
8
https://dividendguy67.blogspot.com
#
Stock
Score
Daily Stocks
Stock Name
Last
Change
Volume
Stock Name
Last
Change
Volume
Stock Name
Last
Change
Volume
MQ Trading Signals
Stock
Time
Signal
Duration
Stock
Time
Signal
Duration
Featured Advertisers / Partners


Ride The Bull Short The Bear
CS Tan
4.9 / 5.0
This book is the result of the author's many years of experience and observation throughout his 26 years in the stockbroking industry. It was written for general public to learn to invest based on facts and not on fantasies or hearsay....