


Icon8888 Gossips About Stocks
(Icon) Apollo Food - All Eyes on Coming Quarter Results


Apollo Food Holdings Bhd (APOF) Snapshot
|
Open
4.28
|
Previous Close
4.28
|
|
|
Day High
4.29
|
Day Low
4.28
|
|
|
52 Week High
08/26/14 - 5.25
|
52 Week Low
12/16/14 - 4.05
|
|
|
Market Cap
342.4M
|
Average Volume 10 Days
17.6K
|
|
|
EPS TTM
0.33
|
Shares Outstanding
80.0M
|
|
|
EX-Date
12/10/14
|
P/E TM
12.8x
|
|
|
Dividend
0.25
|
Dividend Yield
5.84%
|
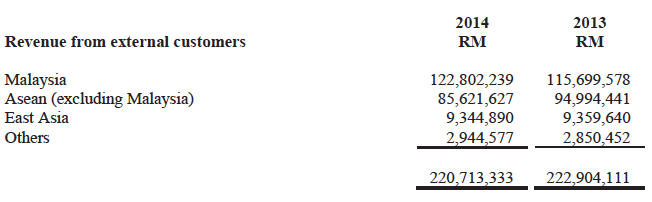
The group exports 35% of its products :-
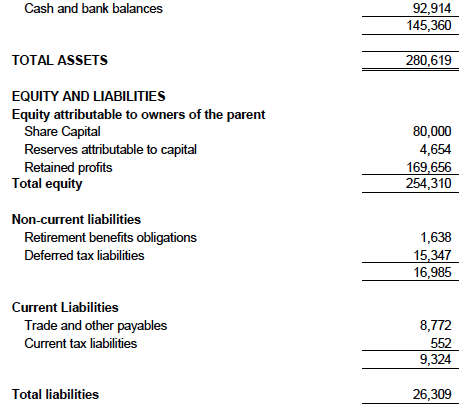
The group has strong balance sheets. With net assets of RM254 mil, zero loans and cash of RM92.9 mil, net cash is RM1.16 per share.
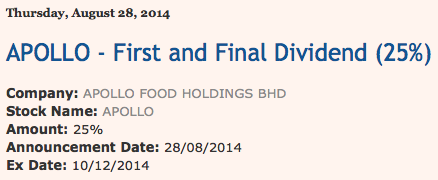
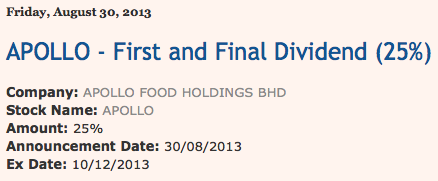
The company paid 25 sen dividend in FY2014 and FY2013. Based on RM4.30 share price, dividend yield is 5.8%.
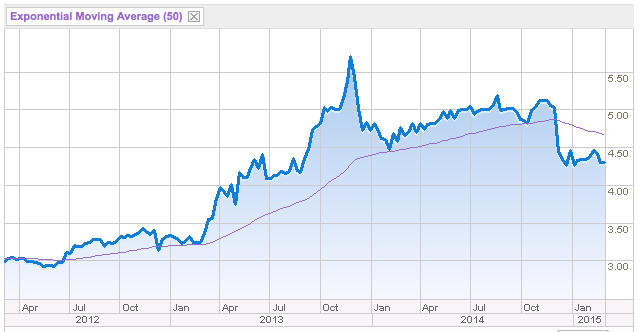
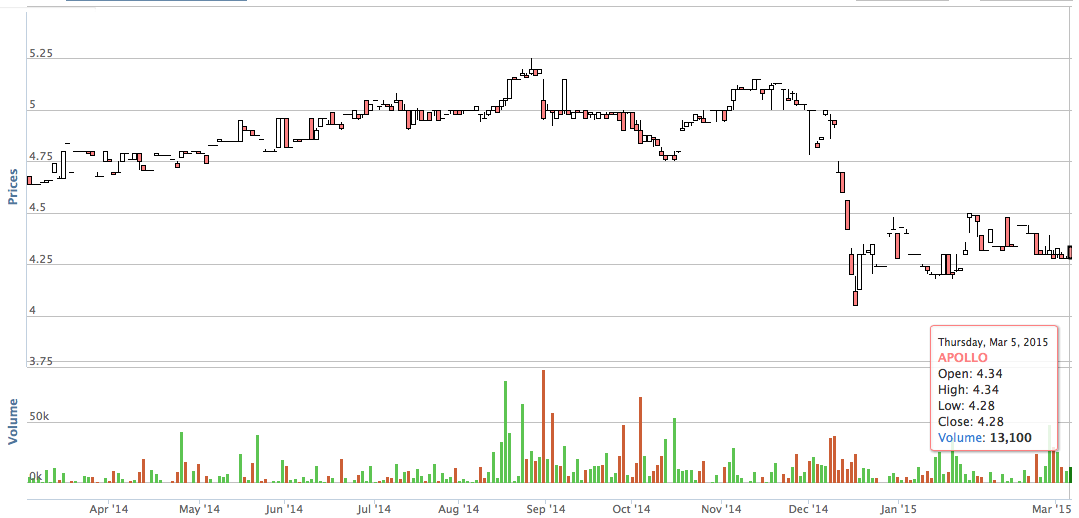
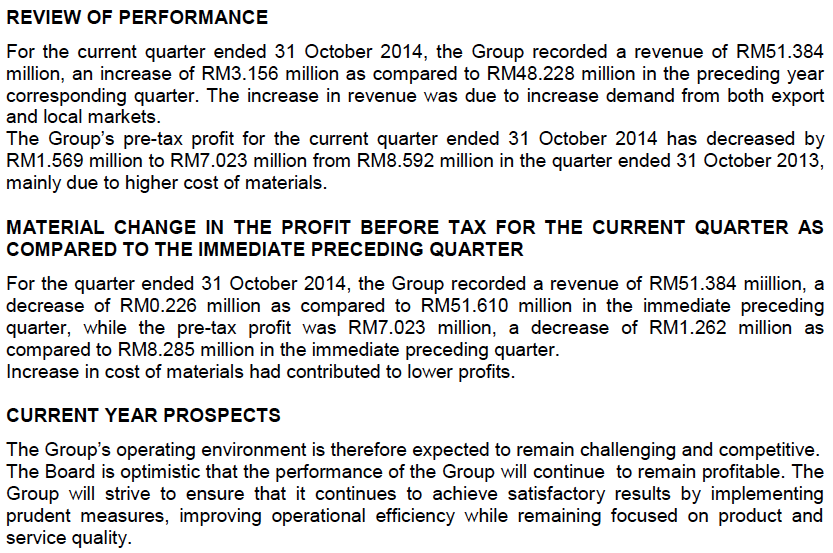
The stock has been trading at above RM5 most of last year. However, share price experienced a sharp drop after it announced its October 2014 quarterly results on 22 December 2014. Net profit came in below expecations. Company cited high raw material cost as the principal reason.
Quarter Result:
| F.Y. | Quarter | Revenue ('000) | Profit before Tax ('000) | Profit ('000) | Profit Attb. to SH ('000) | EPS (Cent) | DPS (Cent) | NAPS | |
|---|---|---|---|---|---|---|---|---|---|
| 2015-04-30 | 2014-10-31 | 51,384 | 7,023 | 4,811 | 4,811 | 6.01 | - | 3.1800 |
|
| 2015-04-30 | 2014-07-31 | 51,610 | 8,285 | 5,716 | 5,716 | 7.15 | - | 3.1200 |
|
| 2014-04-30 | 2014-04-30 | 59,208 | 9,270 | 7,090 | 7,090 | 8.86 | - | 3.0500 |
|
| 2014-04-30 | 2014-01-31 | 55,592 | 11,823 | 9,070 | 9,070 | 11.34 | - | 2.9600 |
|
| 2014-04-30 | 2013-10-31 | 48,228 | 8,592 | 6,597 | 6,597 | 8.25 | - | 3.1000 |
|
| 2014-04-30 | 2013-07-31 | 57,478 | 13,920 | 10,713 | 10,713 | 13.39 | - | 3.0100 |
|
| 2013-04-30 | 2013-04-30 | 54,697 | 9,574 | 7,132 | 7,132 | 8.92 | - | - |
|
| 2013-04-30 | 2013-01-31 | 56,970 | 12,200 | 9,288 | 9,288 | 11.61 | - | 2.7900 |
|
| 2013-04-30 | 2012-10-31 | 52,275 | 10,227 | 7,648 | 7,648 | 9.56 | - | 2.8700 |
|
| 2013-04-30 | 2012-07-31 | 58,804 | 10,449 | 8,016 | 8,016 | 10.02 | 20.00 | 2.7800 |
|
| 2012-04-30 | 2012-04-30 | 56,193 | 9,489 | 8,740 | 8,740 | 10.93 | - | - |
|
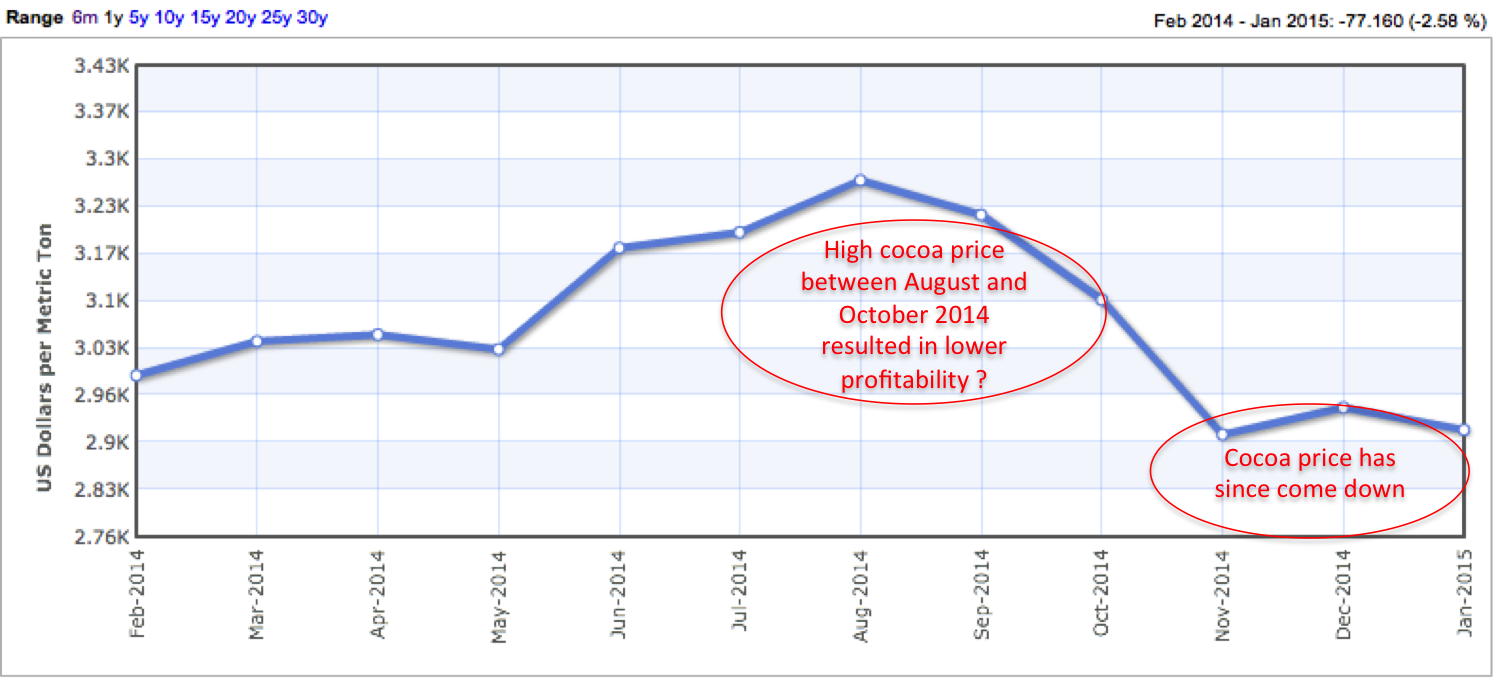
Not sure why there was a spike in raw material cost between August and October 2014. One possibility was higher cocoa price.
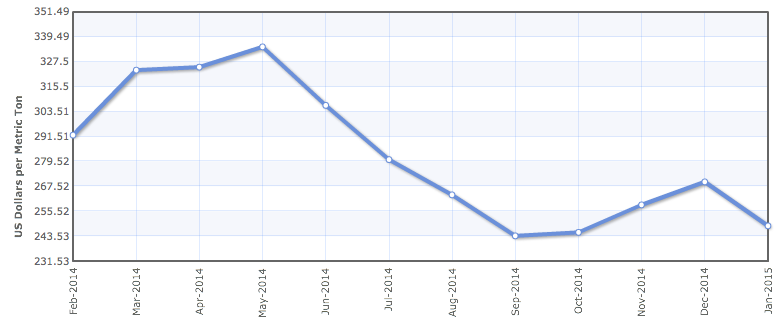
Another factor that might have impact on profitability is wheat price (flour). According to the chart below, it seemed that wheat price was more or less stable between August and December 2014. As such, it should not have much impact on the coming quarter's raw material cost.
As Apollo exports 35% of its products, strengthening of US Dollar vs Ringgit should result in higher profit margin.
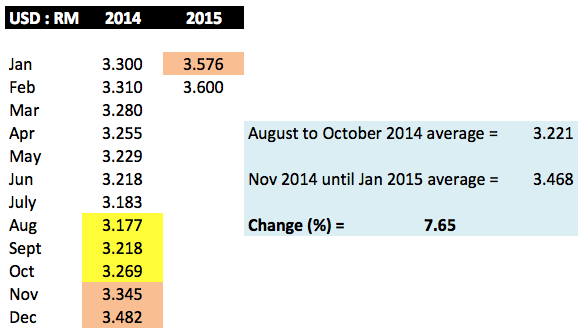
A quick check showed that average USD : RM exchange rate during the period from August until October 2014 was 3.221.
During the period from November 2014 until January 2015, the average exchange rate was 3.468.
The difference was 7.6%.
Based on my recent experience with other PLCs, weakening of Ringgit even though will boast profit margin, it would have an adverse impact on foreign currency loans and trade payables.
According to October 2014 quarterly report, the group does not have any foreign currency loan (they don't have any loan at all) and trade payable is only RM8.77 mil. As such, the depreciation of Ringgit is unlikely to give rise to material forex losses.
The group's export sales is expected to benefit from the weaker Ringgit as every US Dollar will now translate into higher Ringgit sales. Raw material price has come down in US Dollar terms. However, the weakening of Ringgit will result in higher import cost. All these factors come together will determine the group's coming quarterly results.
=======================================
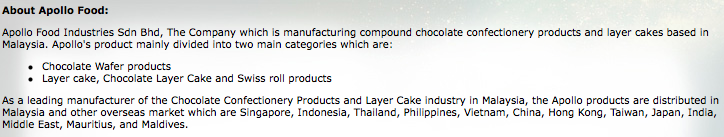
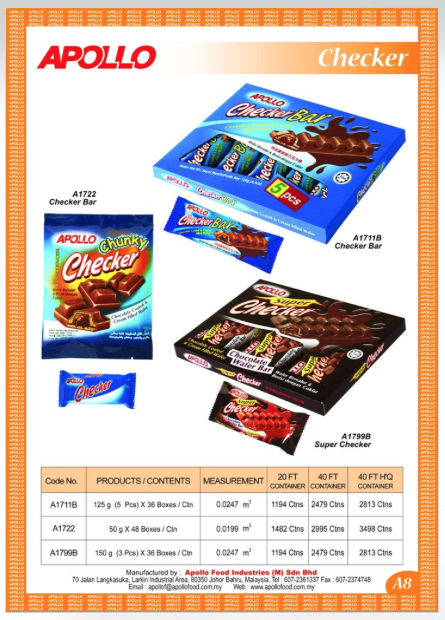
Appendix - Apollo's Products
(1) Wafer Products
Wafer products by Apollo (there are many other types)
(2) Layer Cake Products
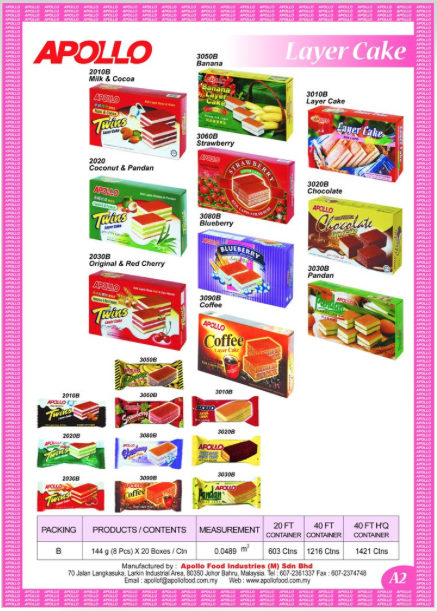
Layer cake products by Apollo (there are many other types)
(3) Swiss Roll Products
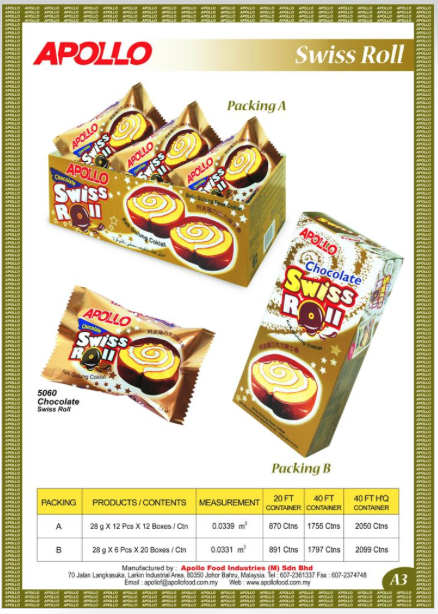
Swiss roll products by Apollo
Related Stocks
| Chart | Stock Name | Last | Change | Volume |
|---|
More articles on Icon8888 Gossips About Stocks
(Icon) Jaks Resources - IRR Model Shows That RM300 mil Net Profit p.a. For 30% Stake Is Plausible
Created by Icon8888 | May 01, 2020
(Icon) Notion VTec - Forget About The Virus, It Is Time To Rock and Roll
Created by Icon8888 | Mar 10, 2020
(Icon) Sam Engineering - Excellent Result. Share Price Can Potentially Double Within 2 Years
Created by Icon8888 | Mar 01, 2020
(Icon) Alliance Bank - One Off Provision Affected Previous Quarter Earning. Time To Buy On Weakness
Created by Icon8888 | Nov 13, 2019
Featured Posts
Introducing MY's First IPO Fund for Sophisticated Investors!
New Update. Discover investment communities that resonate with your ideas
M & A Value Partners IPO Equity Fund has been launched - Targeted 13% Return p.a
Latest Videos


MQ Trading Signals
Time
Signal
Duration
Type
2024-07-23 16:40:00
EMA 5
5 Mins
SELL
2024-07-23 16:40:00
ADX
5 Mins
SELL
2024-07-23 16:40:00
TURTLE SYSTEM 20
5 Mins
SELL
2024-07-23 11:20:00
EMA 5
10 Mins
BUY
2024-07-23 11:10:00
ADX
10 Mins
BUY
Apps


Top Articles
1
BFM Podcast
2
Koon Yew Yin's Blog
3
CGS-CIMB Research
Genting Plantations - Proposed Land Acquisition in Indonesia
5
save malaysia!
6
Koon Yew Yin's Blog
7
save malaysia!
8
#
Stock
Score
Daily Stocks
Stock Name
Last
Change
Volume
Stock Name
Last
Change
Volume
Stock Name
Last
Change
Volume
Featured Advertisers / Partners


Ride The Bull Short The Bear
CS Tan
4.9 / 5.0
This book is the result of the author's many years of experience and observation throughout his 26 years in the stockbroking industry. It was written for general public to learn to invest based on facts and not on fantasies or hearsay....