


iVSA Stock Review
Holistic View of IFCAMSC with Fundamental Analysis & iVolume Spread Analysis (iVSAChart) - 4 Nov

Is IFCAMSC Berhad Worth Investing Given The Current Price Drop?
IFCA MSC Berhad engages in the research and development of enterprise business solutions. Its general software solutions include office automation, group accounting, human capital management, group purchasing, project accounting, enterprise financial management, and e-commerce solutions. The company's industry software solutions comprise property development, property management, construction and project cost, hotel management, and club management software solutions. In addition, it provides turn key solutions, as well as involves in installing and servicing computer hardware and networks. IFCA MSC Berhad provides its services primarily in Asia, Africa, and Australia. It serves various industries, including contract accounting; property development and management; hotel, club, and resort; manufacturing and distribution; finance/leasing; customized IT projects; and hardware and networking industries. The company was founded in 1987.
It is a SME (Small & Medium Enterprise) company with annual revenue of RM89 million in 2014.Its share price has suffered a plunge this year, from RM1.87 in May 15 to RM0.46 in August 15 and currently atRM0.89. It may seem attractive to invest but investors are advice to look closer in to the company’s value by evaluating its financial performance. The following table shows the key financial figures of this company based on their latest financial year report (FY2014).
|
Company |
IFCAMSC (FY2014) |
|
Revenue (RM’000) |
89,241 |
|
Net Earnings (RM’000) |
21,077 |
|
Net Profit Margin (%) |
23.618 |
|
Total Debt to Equity Ratio |
0.003 |
|
Current Ratio |
3.363 |
|
Cash Ratio |
2.404 |
|
Dividend Yield (%) |
3.39 |
|
PE Ratio |
23.91 |
Revenue of IFCA MSC has been fluctuating between RM25 million to RM35 million since Financial Year (FY) 2005 till FY2011. After FY2011, its revenue has been growing rapidly for the next 3 years with an average year to year growth of 33.5% between FY2011 till FY2014.
However, in terms of net earnings for the past 10 years, IFCA has suffered losses for 4 out of 10 financial year (FY2007 till FY2010, which is during the Lehman Brother Crisis years). For remaining 6 out of past 10 financial years, its net earnings were not much better (besides the most recent FY2014), the company has net earnings of only between RM1 million to RM3 million.
There is a sudden jump in earnings for FY2014 which is a record RM21 million. This is due to the great increase in revenue whereby revenue from software applications doubled in FY2014 and cost of operation in the same year increased in a smaller proportion. With this sudden surge of net earnings, it brings the company’s net profit margin to 23.6% which is quite high compare to industrial average.
Although earnings of this company is considered inconsistent, one of this company’s greatest strength is their close to zero debt account, which brings us to a close to zero Total Debt to Equity Ratio, a high current ratio of 3.36 and a high cash ratio of 2.40.
Although the 3.39% dividend yield looks attractive to dividend seekers, important point to take note is that this company has only paid dividend once since listed. Hence dividend seekers might want to think twice as they have not establish a great track record in dividend paying.
In conclusion, IFCA MSC is a small to midsize company which still have plenty of room to grow and stabilise its financial performance, especially in terms of net earnings. Due to the inconsistent track record of its net profit, investors should consider to invest only when the company could sustain its FY2014 performance for the next two to three years (growing net earnings with good net profit margin of 15% to 20%).
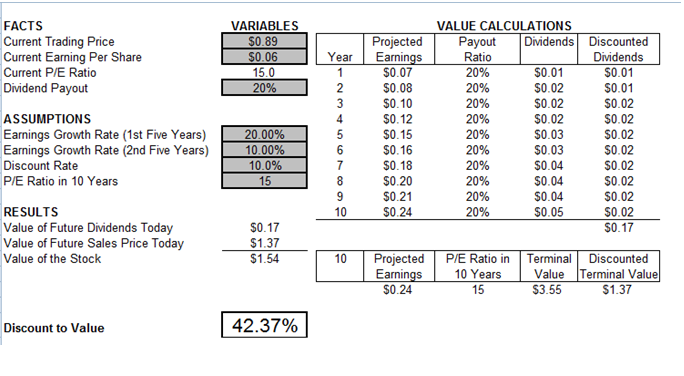
Calculation of Intrinsic Value Using DCF - IFCAMSC with Discount 42.4%
iVolume Spread Analysis (iVSA) & comments based on iVSAChart software - IFCAMSC
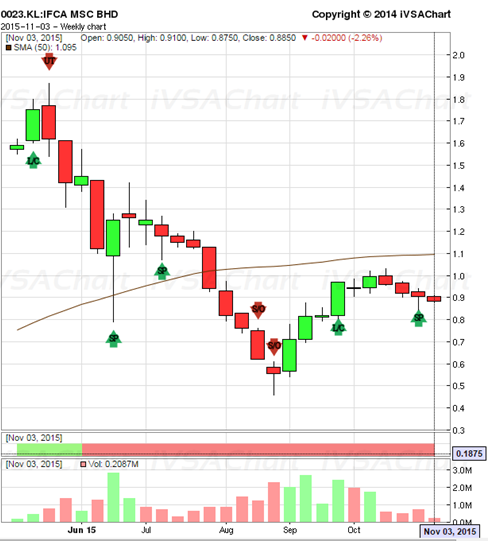
iVSAChart Comment:
On IFCAMSC weekly chart, chart background is still bearish (red trend region) and trending below 50d MA.
The stock made transition from stage 4 to stage 1 on week 28 Aug at high volume and to stage 2 on subsequent bars at high volume. However, starting on week 16 Oct bar, the stock price started to trade sideways testing the selling supply at relatively low volume with evident support level at RM0.90. As long this support line is not violated, then stage 2 is still on the way.
Any breach of this support line may indicate downtrend particularly if it violated second support line at RM0.45.
More articles on iVSA Stock Review
Holistic View of Leon Huat with Fundamental Analysis & iVolume Spread Analysis (iVSAChart)
Created by Joe Cool | Dec 15, 2016
Holistic View of Tomypak with Fundamental Analysis & iVolume Spread Analysis (iVSAChart)
Created by Joe Cool | Dec 15, 2016
Holistic View of ECS IT with Fundamental Analysis & iVolume Spread Analysis (iVSAChart)
Created by Joe Cool | Dec 01, 2016
Holistic View of Magni-Tech with Fundamental Analysis & iVolume Spread Analysis (iVSAChart)
Created by Joe Cool | Dec 01, 2016
Holistic View of Teo Seng with Fundamental Analysis & iVolume Spread Analysis (iVSAChart)
Created by Joe Cool | Nov 14, 2016
Holistic View of QL Resources with Fundamental Analysis & iVolume Spread Analysis (iVSAChart)
Created by Joe Cool | Nov 03, 2016
Holistic View of Top Glove with Fundamental Analysis & iVolume Spread Analysis (iVSAChart)
Created by Joe Cool | Oct 24, 2016
Holistic View of Scientex with Fundamental Analysis & iVolume Spread Analysis (iVSAChart)
Created by Joe Cool | Oct 24, 2016
Holistic View of KESM with Fundamental Analysis & iVolume Spread Analysis (iVSAChart)
Created by Joe Cool | Oct 17, 2016
Featured Posts


Latest Videos


Apps


Top Articles
1
南洋行家论股
3
The Alpha Trader
4
BreakingOut
5
Koon Yew Yin's Blog
6
Bursa Stock Musings - Thoughts & Ideas
PGF Capital - insti shareholding up from 5% to 14%! (part 1)
7
南洋行家论股
8
RHB Investment Research Reports
#
Stock
Score
Daily Stocks
Stock Name
Last
Change
Volume
Stock Name
Last
Change
Volume
Stock Name
Last
Change
Volume
MQ Trading Signals
Stock
Time
Signal
Duration
Stock
Time
Signal
Duration
Featured Advertisers / Partners


Ride The Bull Short The Bear
CS Tan
4.9 / 5.0
This book is the result of the author's many years of experience and observation throughout his 26 years in the stockbroking industry. It was written for general public to learn to invest based on facts and not on fantasies or hearsay....