


7 minutes ago
![]() supersaiyan3 Finally Dealed. Make little bit of money is one thing, peace is prolonged j...
supersaiyan3 Finally Dealed. Make little bit of money is one thing, peace is prolonged j...
2 hours ago
![]() Holdom2040 Let YHB = YPOHL
Holdom2040 Let YHB = YPOHL
YHB = 8b market cap
Investor inject RM6b
%money injected = 6b...
2 hours ago
![]() Agjl Right now everythg is uncertain. Nobody knows wat trump may do when he is in? ...
Agjl Right now everythg is uncertain. Nobody knows wat trump may do when he is in? ...
2 hours ago
![]() StakesAreHigh Im going to Genting this weekend. Lets go enjoy the fresh air and some casino ...
StakesAreHigh Im going to Genting this weekend. Lets go enjoy the fresh air and some casino ...
General Wise, mature and knowledgeable doc!
To establish that Akmalkin's accusation violates anti-fake news and multimedia...
News & Blogs Blog: 'Fast Money' traders talk tech sliding and if its a sign of more downturn or a market refresher
Trump2 will hit tech badly
Tech export directly to USA and indirectly throu...
News & Blogs Blog: A TALE OF 3 GLOVES IN PICTURES : COMFORT GLOVE, TOPGLOVE & SUPERMAX, Calvin Tan Research
Calvin, after impoverishing traders in the tech triad, you repeat your modus o...
News & Blogs Blog: What other i3 investors forum members said about Calvin Tan (unsolicited comments through the years)
Another one got mental problem is Sidney Oon of SEE_Research from Puchong
emo...
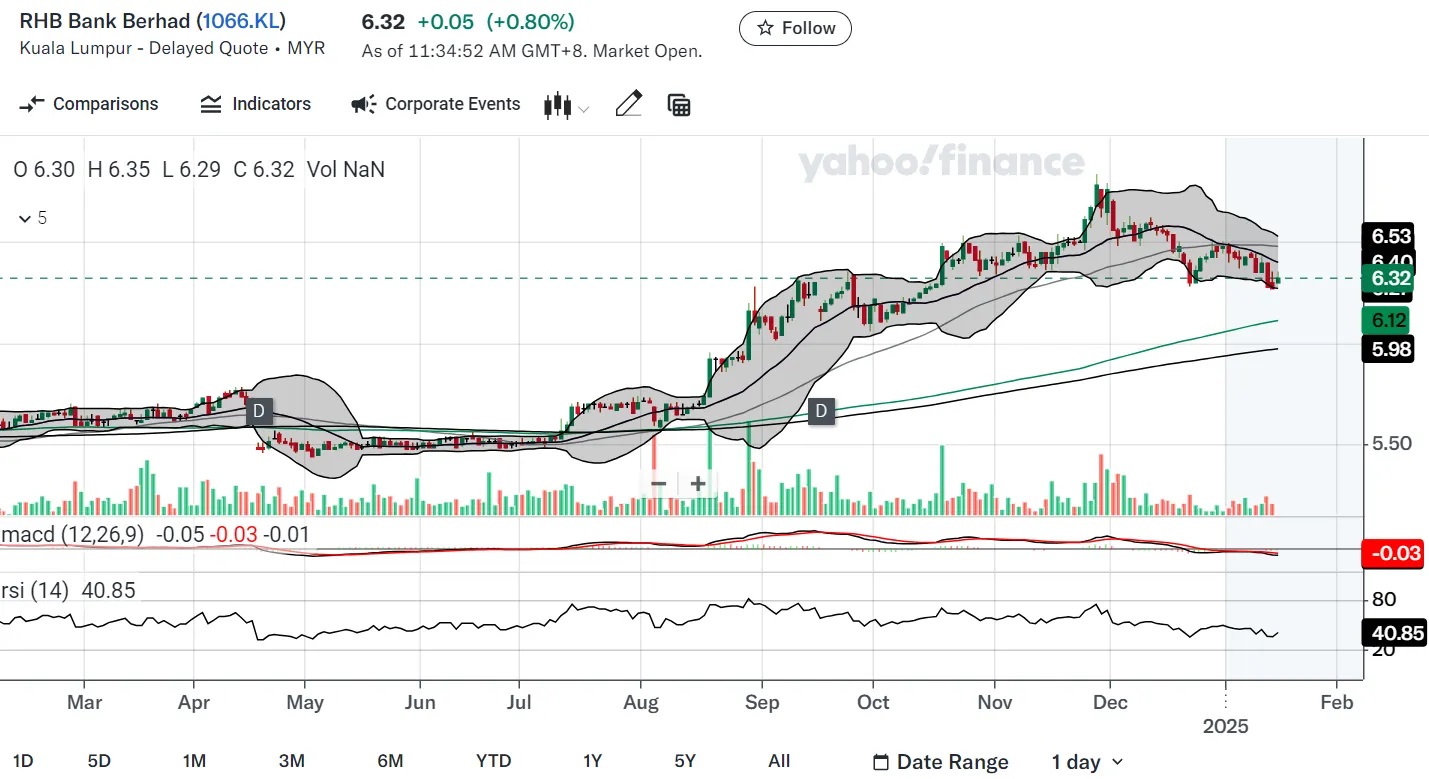
News & Blogs Blog: Technical Outlook: RHBBANK
RHB is downtrend counter. Do not touch. Wait for the price trend become not be...
News & Blogs Blog: India’s RBI Governor Signals He’s Open to More Flexible Rupee
@ks55...you are a THIEF...you committed CBT stealing money from your employee ...
mplus313 . 2025-01-15
Bxtrade . 2025-01-15
Patriciaa . 2025-01-15
MQ Trader . 2025-01-15
Futurescoin . 2025-01-15
Daily Futures Trading Strategy 15 Jan 2025 - Global Market Index
MHAB1990 . 2025-01-15
COLFORM GROUP BERHAD SASAR RM41.19 JUTA DARIPADA IPO PASARAN ACE

fireinabidin999 . 2025-01-15
COLFORM GROUP BERHAD TARGETS RM41.19 MILLION FROM ACE MARKET IPO
2025-01-13
Indices


Market Summary
Gainers
193
Losers
964
Unchanged
419
Untraded
799
Daily Stocks
Stock Name
Last
Change
Volume
Stock Name
Last
Change
Volume
Stock Name
Last
Change
Volume
MQ Trading Signals
Stock
Time
Signal
Duration
Stock
Time
Signal
Duration
Stock
Price Target
Price Call
Firm
Date
Stock
Type
Quarter
Stock
YoY Growth
Ann. Date
Stock
Dividend
Stock
Subject
Amount
TWL HOLDINGS BERHAD - REDEEMABLE CONVERTIBLE UNSECURED LOAN STOCKS 2023/2028
5.0000%
Ann. Date
Stock
Type
Stock
Name
Type
Stock
Name
Type
Ann. Date
Stock
Units
Search i3investor
Featured Posts


Latest Videos


Apps


Top Articles
1
2
Good Articles to Share
Eli Lilly CEO on Fighting Cancer and Obesity, Drug Pricing (Correct)
3
Good Articles to Share
Evercore ISI's Julian Emanuel says its too early to buy weakness
4
Good Articles to Share
5
Good Articles to Share
6
Good Articles to Share
7
Good Articles to Share
Tens of thousands demonstrate in nationwide strike in Belgium | REUTERS
8
Good Articles to Share
#
Stock
Score
Featured Advertisers
AmEquities (LYH)
Cash upfront (brokerage 0.05% flat), T+2 / T+7 account (3x cash, 2x share), Margin account (competitive interest)
TA Securities (DJS)
Cash collateral (1x cash, 1x share), T+2 / T+7 account (3x cash, 2x share), Margin account (flexible margin)
M+ Online Kulai Branch
Cash upfront (brokerage 0.05% - 0.08%), T+2 / T+7 account (2x cash, 1x share)
Featured Advertisers / Partners


Asia Analytica's Top Picks for 2024
Moving into 2024, we think two specific industries could do well, namely the construction and digita...
The Star's Stock Pick 2024
The Star's Stock Pick 2024
MPLUS 1Q24 Market Chat: Reboot, Realign and Revitalise
The US GDP continues to grow, while inflationary pressure has been cooling off throughout the year. ...
TA Research Top Picks for 2024
TA research shared a few key investment themes for 2024, which are the digital economy, domestic spe...
Maybank Investment Bank's Top Mid-Small Cap Buys for 2024
2024 should be a better year for Malaysia on several fronts. It will be a year of execution of the m...

Ride The Bull Short The Bear
CS Tan
4.9 / 5.0
This book is the result of the author's many years of experience and observation throughout his 26 years in the stockbroking industry. It was written for general public to learn to invest based on facts and not on fantasies or hearsay....
Regional Stocks - SG
Stock Name
Last
Change
Volume