


https://dividendguy67.blogspot.com
AMFIRST - More Downtrend or Consolidation or Reversal imminent?

Background
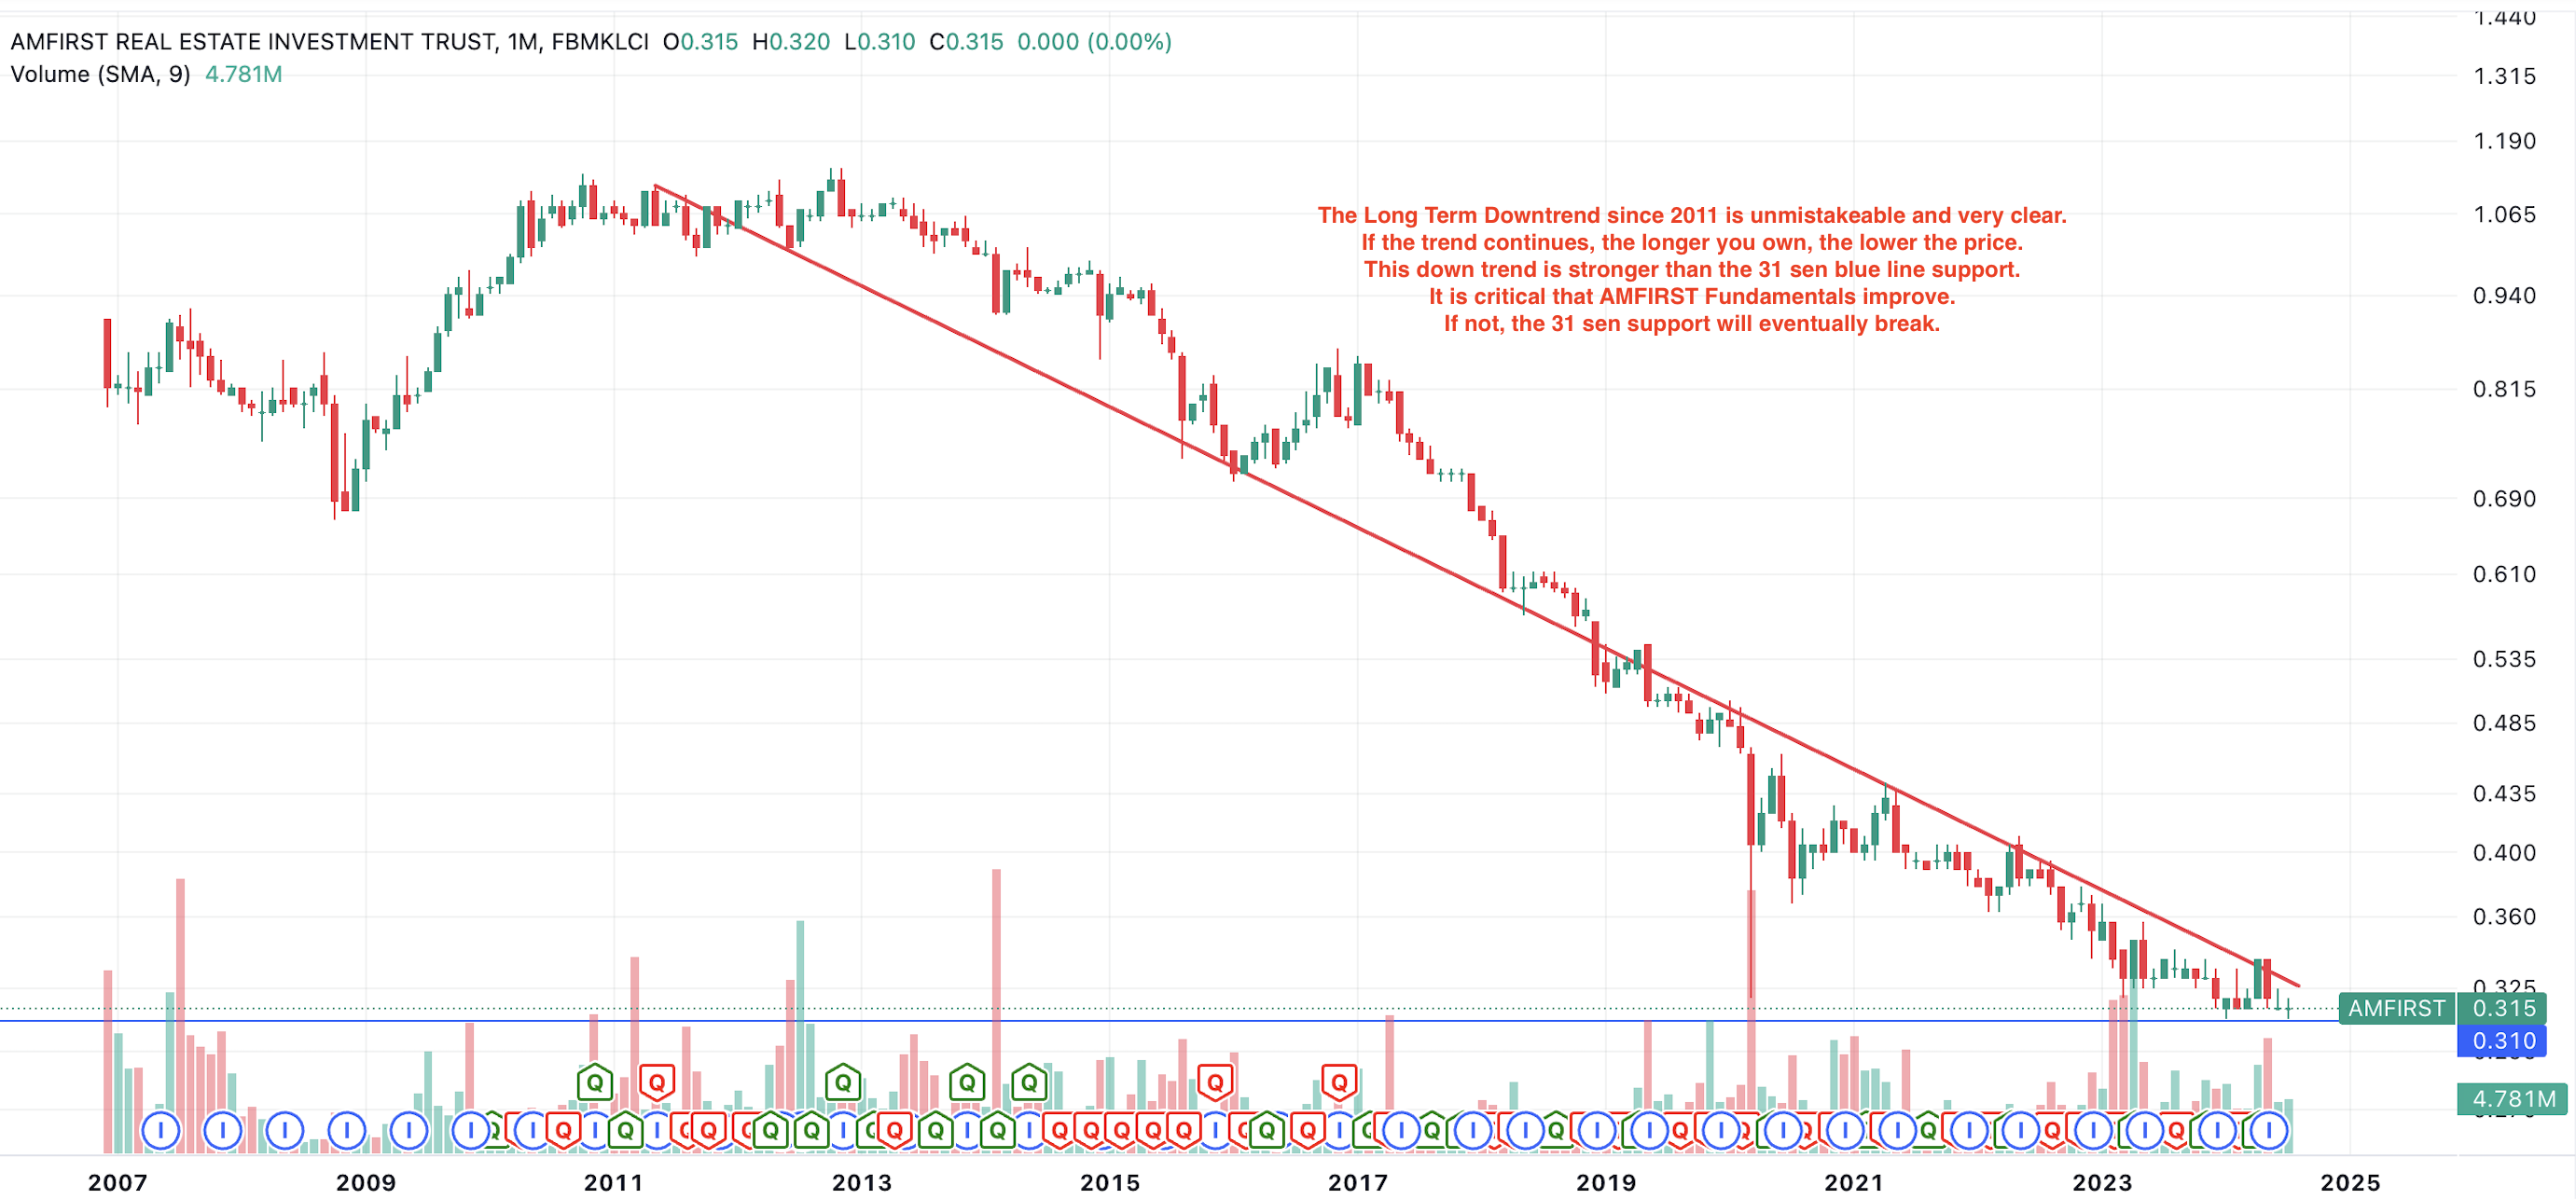
If you are a LWA (Lifetime Wealth Accumulator), AMFIRST is a good example of a stock that you don't want to own. Just look at its long term price chart since 2010 peak. Clear downtrend - price keeps making lower highs and lower lows, and at the time of writing, it is still showing a lower high in 2024. The thick red down trend line is very clear. Price appears to try to find support at 31 sen, as shown by the thinner horizontal blue line but price haven't resolved yet, the triangle haven't met yet (maybe in 2025) and only by then will we know. In 2024, it looks like there may be a "box consolidation" i.e. it is trying to spend time to figure out whether it is bottom yet or not, but the jury is still undecided.
Current and Past 10 year fundmental metrics
Last year, I first made a small entry into AMFIRST, to test if I can include AMFIRST into my diversified range of REIT holdings. In a bigger picture scheme, total REIT is around 20%-25% of my total diversified portfolio, and AMFIRST is a small piece in there. REIT as a class is not a bad asset class for passive dividend income investor, because of its regular income. The hope is that over time, the income from REIT as a class will grow, to provide a growing passive income during retirement. But it clearly doesn't come from AMFIRST.
Why I considered AMFIRST last year was its very high dividend yield and euphoria. I am still vulnerable to euphoria impacting my judgement. At that time, I thought it may be bottoming - and that "thought" is the culprit. There's huge difference between "thought" vs "evidence" - simply put, there was no sign of bottoming yet last year. Instead, that "thought" was really "hope" or "wishful thinking". 2.7 sen / average of 33 sen = 8.2% dividend yield or roughly 7.3% net. Too high to be true long term isn't it?
Dividend Yield
So, the dividend yield has now dropped to 2 sen, from 2.7 sen prior. Quite a sizeable drop = 26% drop. Is it too much?
Current price 31.5 sen. DY = 2 sen / 31.5 sen = 6.3% gross of tax, or roughly 5.7% net of tax. Now, the Net DY of 5.7% looks more reasonable.
Past 10 Year CAGR metric
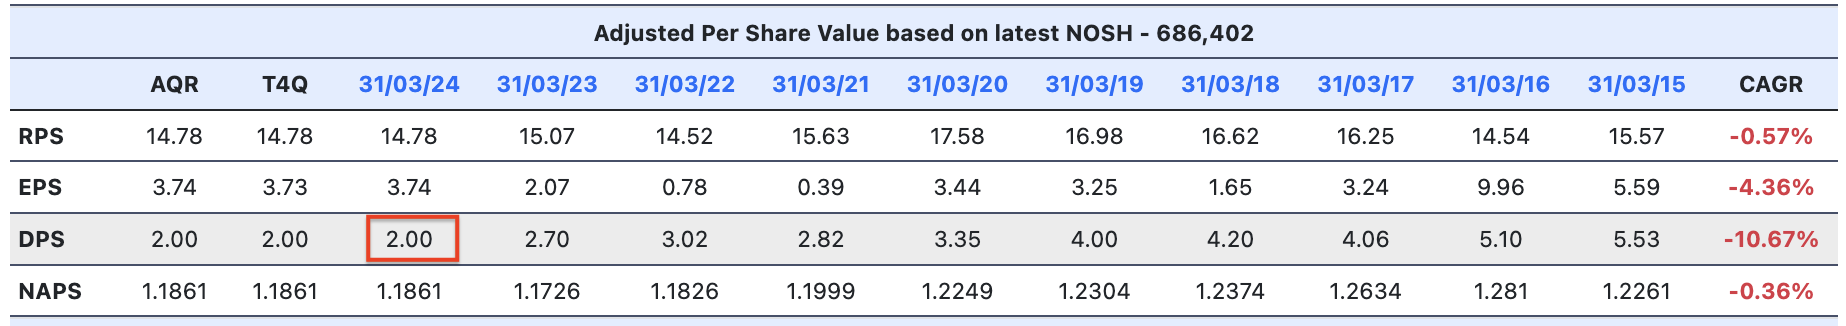
Over the past 10 years, it is still ugly, across the main metric (DPS) and the related metrics of NAPS, RPS, EPS. What this is saying is that:
1. The dividends to investors is still shrinking.
2. The Net Assets behind the REIT, may not be growing over past 10 years and this is concerning. Ideally, you want to see rising rental incomes, rising market values and by right, rising Net Assets but this isn't happening over 10 years. This means the asset quality of the holdings may not really be that great, if its values cannot rise after 10 years.
3. The RPS is basically saying that the gross revenues, isn't exactly growing too. I interpret this as a high level indicator that says that the revenues and income of the REIT isn't growing. Another danger sign.
4. Whilst EPS is not quite the same (there's some accounting gaps between reported EPS and what REIT holders actually gets), on same technical basis, the trend is also not encouraging to encourage you to deep dive deeper. It's declining too.
P/BV
Many AMFIRST investors got trapped thinking the DY is high (>8%) and the price is cheap because P/BV is so low, comparing current price of 31.5 sen vs NAPS of RM1.19. The gap or "Margin of Safety" looks huge. But that gap keeps increasing since 2014 i.e. it's now 10 years of rising gap. 10 years of persistent under-valuation. Will it reverse?
The question is why the persistent gap?
If you ask Mr Market, Mr Market will say he didn't believe in the reported Book Values, and expects this to be revalued down. Why? Because the real life rental incomes are much lower.
But if it is to be marked-down one day, how much? From 1.19 down to 31.5 sen? So much? Well, until rents rises, this is the big unknown.
When will it be marked down happen? That depends on insiders/hidden decision. Are insiders accumulating? Have insiders accumulated enough yet? Retail public will never know.
Quarterly Fundamentals
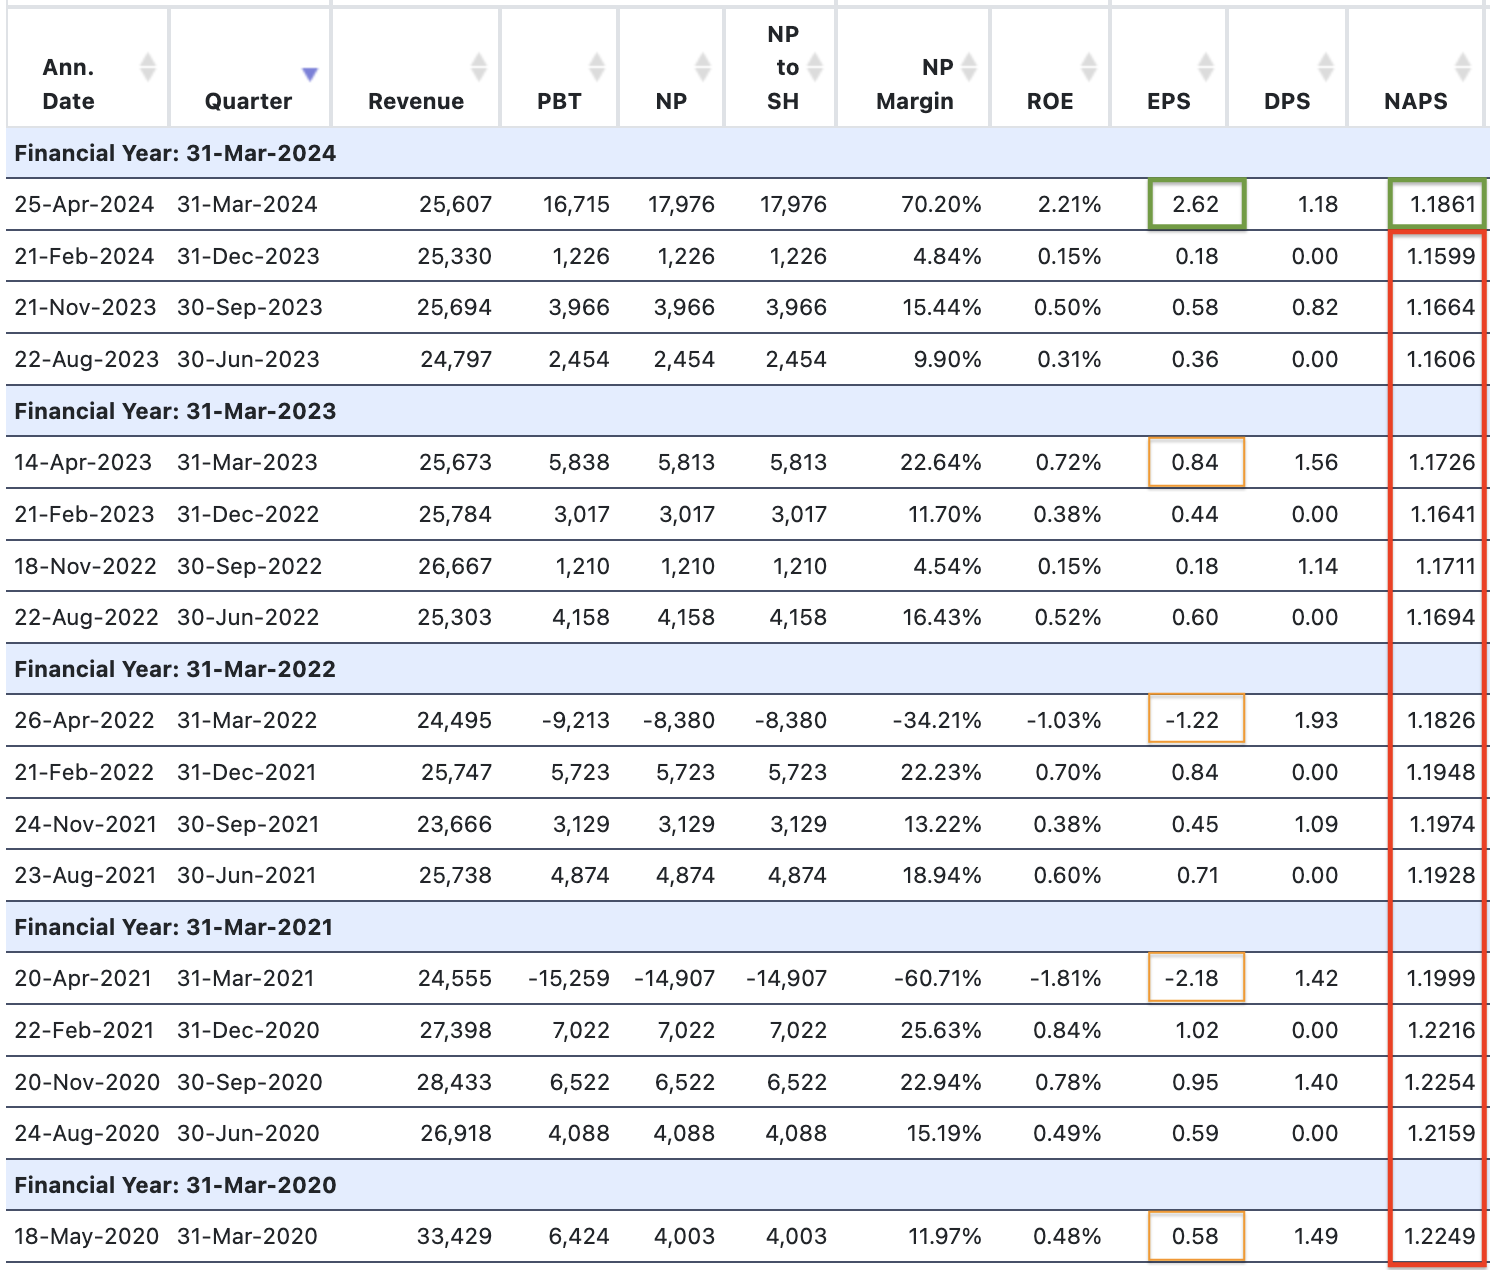
It's worth monitoring the YoY quarterly performance for signs of potential turnaround.
Q4/24 EPS of 2.62 sen is surprisingly large relative to prior Q4s.
But beware that this is a stock that is persistently "undervalued" relative to NAPS.
AMFIRST distribute dividends twice a year. The question is what is 2Q DPS will look like. Will it be higher than 82-114 sen? If AMFIRST revenues, net profits has really turned around to deliver DPS higher than 114 sen, then, likely we will have seen the bottom. However, the question is - can it? Can it deliver higher dividend in 2Q?
Weekly Chart
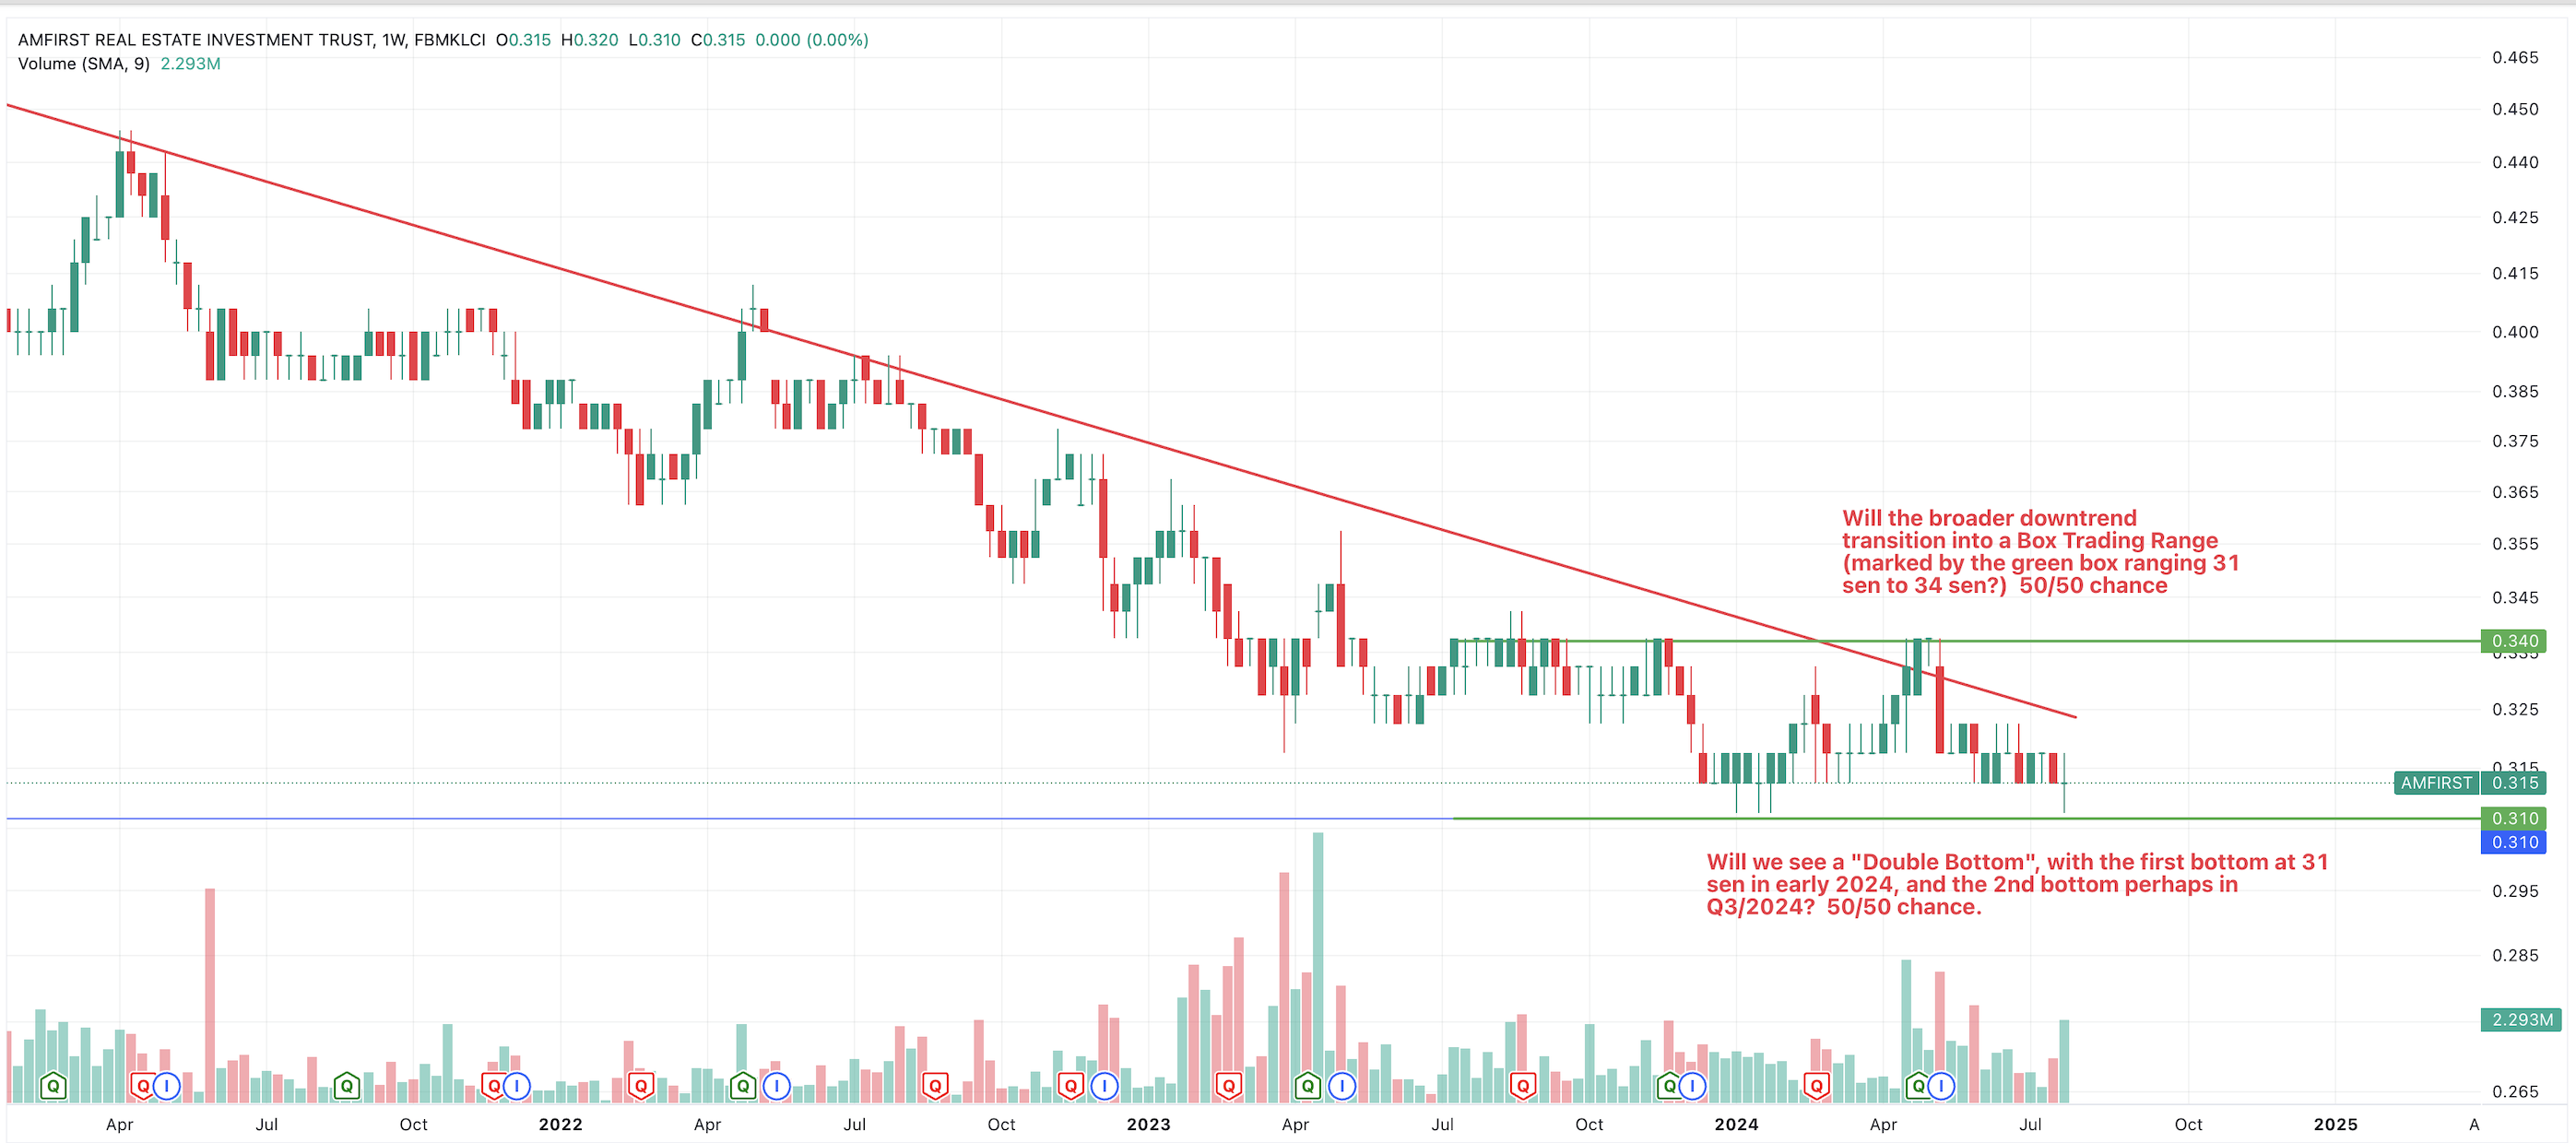
The weekly chart above shows a "potential" transition from downtrend to sideways consolidation like a box bounded by the green lines (31 sen to 34 sen), and a potential double bottom at 31 sen in Q1 and Q3 2024. Potential is not guaranteed, in fact, I'd say 50/50 chance i.e. I really don't know if it will come true, or it will be false.
What would help tilt the odds, is fundamentals. E.g. I like to see a mark down in Asset Values. Experienced investors and traders know that if such a thing would occur and the NAPS falls from RM1.19 down to say RM1, then, market will be relieved and price tends to jerk up. However, I have no insights as to when / if this will occur at all.
Another example of what I like to see is simply higher quarterly earnings in 1Q/25. Higher than 72 sen. Then, we may see consolidation still but at the higher end of the box range. Followed by good 2Q quarterly earnings and higher DPS declared. If the DPS declared for 2025 tracks at say 3.2 sen, to be clearly higher than 2.7 sen in 2023 and 3.02 sen in 2022, then, we'll see a new higher box range in the 40s.
The potential reward if sideways followed by upwards looks higher if there's a fundamental reason behind it. Else, without this, then, more downtrend looks possible since price tracks earnings - earnings and dividends have to turn around for price to turn around.
Summary and Conclusion
AMFIRST is clearly still downtrending.
- It is too early to conclude that it's turning sideways.
There are some early potential signs of turning sideways
- However odds are only 50/50.
- So, the risks are still high.
- If you are itchy, don't chase when downtrending. Queue at the support, or stay on the sidelines.
For me, I already have a small position since last year
- I have previously added at 31.5 sen.
- I plan to add at 31 sen at 1.5 times the size of what I bought at 31.5 sen and it's sitting in the queue.
If executed, this will bring my total position size to slightly larger than neutral position size.
- Neutral is a small 2% capital.
- It is still small, if I am wrong, I can repeat this again at the lower box range.
However, the set up is promising - 50/50.
- It's good enough odds for me to start positioning. Not certain to be right, 50/50 chance if fundamentals don't improve.
Total returns so far since last year entry is neutral after transaction cost. Clearly losing out to EPF for sure today, but if my anticipation is correct, then, it will eventually beat EPF easily in 1-2 years time. However, the risks is high, 50/50 i.e. coin toss.
Good luck.
Disclaimer: As usual, you are solely responsible for your own trading and investing decision.
Related Stocks
| Chart | Stock Name | Last | Change | Volume |
|---|
More articles on https://dividendguy67.blogspot.com
Discussions
Be the first to like this. Showing 0 of 0 comments
Post a Comment
Featured Posts
Introducing MY's First IPO Fund for Sophisticated Investors!
New Update. Discover investment communities that resonate with your ideas
M & A Value Partners IPO Equity Fund has been launched - Targeted 13% Return p.a
Latest Videos


MQ Trading Signals
Time
Signal
Duration
Type
2024-07-26 16:35:00
EMA 5
5 Mins
SELL
2024-07-26 16:35:00
ADX
5 Mins
SELL
2024-07-26 16:15:00
EMA 5
5 Mins
BUY
2024-07-26 15:55:00
ADX
5 Mins
BUY
2024-07-26 11:00:00
EMA 5
Hourly
SELL
Apps


Top Articles
1
save malaysia!
3
BFM Podcast
4
BFM Podcast
5
BFM Podcast
6
BFM Podcast
7
MQ Market Updates
8
BFM Podcast
#
Stock
Score
Daily Stocks
Stock Name
Last
Change
Volume
Stock Name
Last
Change
Volume
Stock Name
Last
Change
Volume
Featured Advertisers / Partners


Ride The Bull Short The Bear
CS Tan
4.9 / 5.0
This book is the result of the author's many years of experience and observation throughout his 26 years in the stockbroking industry. It was written for general public to learn to invest based on facts and not on fantasies or hearsay....