


Round & Surge Operator Analysis
How To Avoid Resistance Breakout Failed

roundnsurge
Publish date: Thu, 16 Sep 2021, 02:48 PM
roundnsurge
0 59
"True trader react to the market" is the core of our Operator analysis. Operator Analysis analyze the price and volume of the big boys in equity market, where we currently using our analysis in gold market, Bitcoin and Malaysia market.
We will be sharing education material here such as to become a successful trader & investor, corporate action explanation, the financial instrument in the market you can utilize for your investment and more. We are here to help you understand the stock market.
We will be sharing education material here such as to become a successful trader & investor, corporate action explanation, the financial instrument in the market you can utilize for your investment and more. We are here to help you understand the stock market.
Many traders & investors definitely have learned how to draw resistance or support lines to find the best timing for their investment entry.
Technical analysis was/has been the tool for many traders and investors to time the entry for their investment. However, there is always doubt on the reliability of resistance or support breakout for any entry or exit.
Many traders who follow resistance breakout as a form of entry will encounter a problem of resistance breakout failing or getting shaken off by the retrace after the resistance breakout. Price rebound after it hit our cut loss point.
We have the same problem above as everyone in the past and instead of giving up on trading or concluding trading is not the way to invest in the stock market like many “Gurus”.
We dive in & understand how the big boys operate and we find the traditional way of drawing resistance or support lines doesn’t apply to our market and what you have learned from the internet or gurus are all too simplified. Like the examples below on how a traditional resistance line is drawn.
A resistance line is drawn based on the previous high of the stock price (red arrow). Many traders will refer to this as a point where selling pressure comes in, that’s why the price retrace. The more the price retrace at this point, the stronger the resistance. Traders will wait for the resistance line breakout with volume as a signal that the demand is higher than the selling pressure and the trend has changed into a new round of bullish uptrend. When you jump in at the confirmation of the resistance breakout (yellow box), you will feel excited for a few days and the price will start to retrace until your cut loss point.
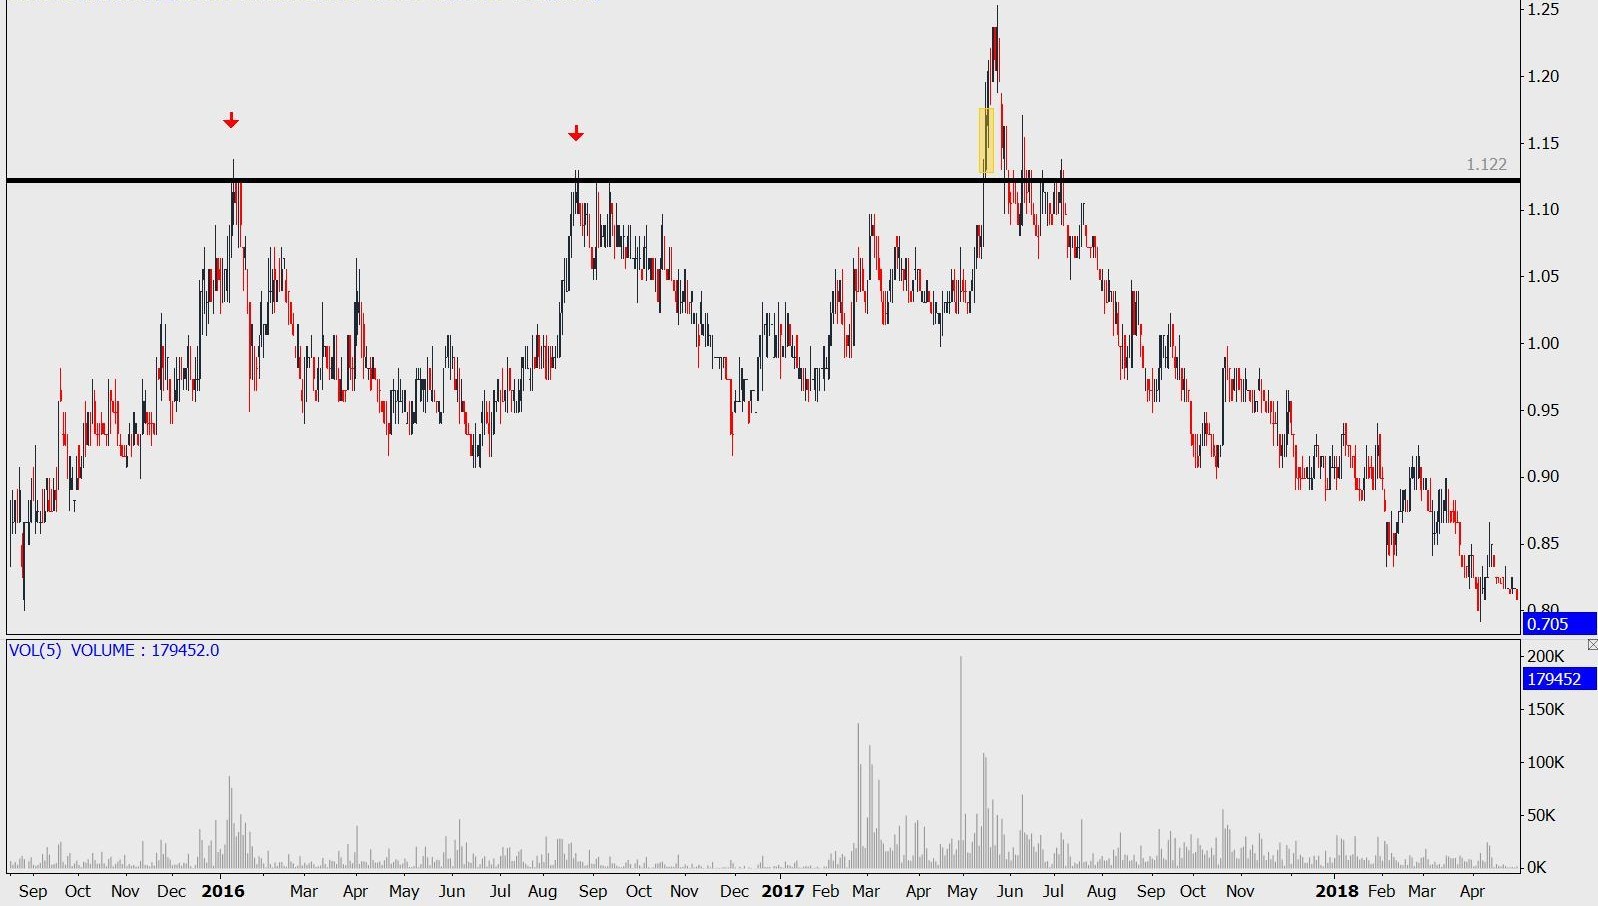
Being optimistic at first about this stock price that it has broken the “Strong Resistance”, high chances that the price will go up further to your own “projected profit target” which derives from the height of the sideways trend. What happened with this stock? Why does the price retrace? Isn’t it a strong breakout?
To find out why we need to understand much more about what resistance is. Saying resistance is the point where supply is more than demand is true. The demand is more than supply when it breaks the resistance is also true!
But we need to understand why there is more supply than demand when it reaches the previous high. When you understand the reasons for supply more than demand at the previous price peak, you will know the intention of the resistance breakout is it really a trend changing into a bull trend or is merely attracting traders to be trapped in these shares.
We all know that the stock market is the big boys' money-making game from the retail investors. (If you are new to our blog or channel, our principle is to follow the big boys' intention by analyzing the transaction data such as price & volume.)
If you agree with us that the stock market plays by the big boy’s rules. Then you should see the selling/buying pressure as the big boys selling/buying. Retail investors always follow or influenced by big sell or big buy in the market. Because every retail investor has a different price target or expectation of the price peak. Therefore, the market price is not determined by the retail investors. If the market price is determined by the retail investors, then most of the resistance breakout would have peaked at the projected profit target but not higher or lower. Obviously, the supply & demand transactions are done by the big boys.
Why do big boys sell and cause resistance to the price up?
Now we know the big boys are selling at the peak of the price which everyone refers to as resistance. This information tells us that the big boys are taking profit by selling their shares by portion at each of the price peaks. This is why resistance is formed.
Why does the price peak at around the same level as the previous high?
Resistance doesn't often form at the same level, some might be higher or lower than others. That’s why many beginners in drawing a resistance line are always confused about where to set the resistance line. The price peaked depends on the retail investors desire to buy the shares at what price. Retail investors ALWAYS park buy orders at lower prices, because they want to buy it cheaper (You are one of them). Big boys will observe the buy orders flow & volume and gauge whether it is sufficient for them to sell the portion of their shares out.
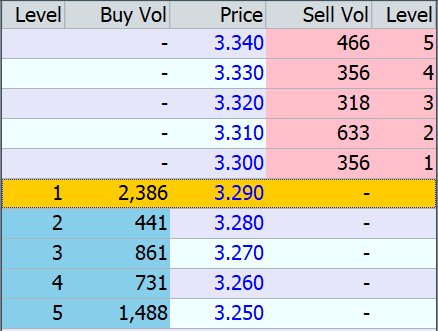
Big boys parking big orders at 1 price to give retail investors an illusion that this is the support. Such buy orders can be cancelled and left the retail investors in the order.
If the buy orders are still low, big boys will continue to push the price higher to create the Fear-Of-Missing-Out and gain investors confidence in these stocks to attract more buy orders. Once the buy orders are sufficient at the buy queue, big boys will start to throw their shares down to those who parked at the buy orders. That’s when the new resistance is formed and retail investors are happy with their purchase at a low price.
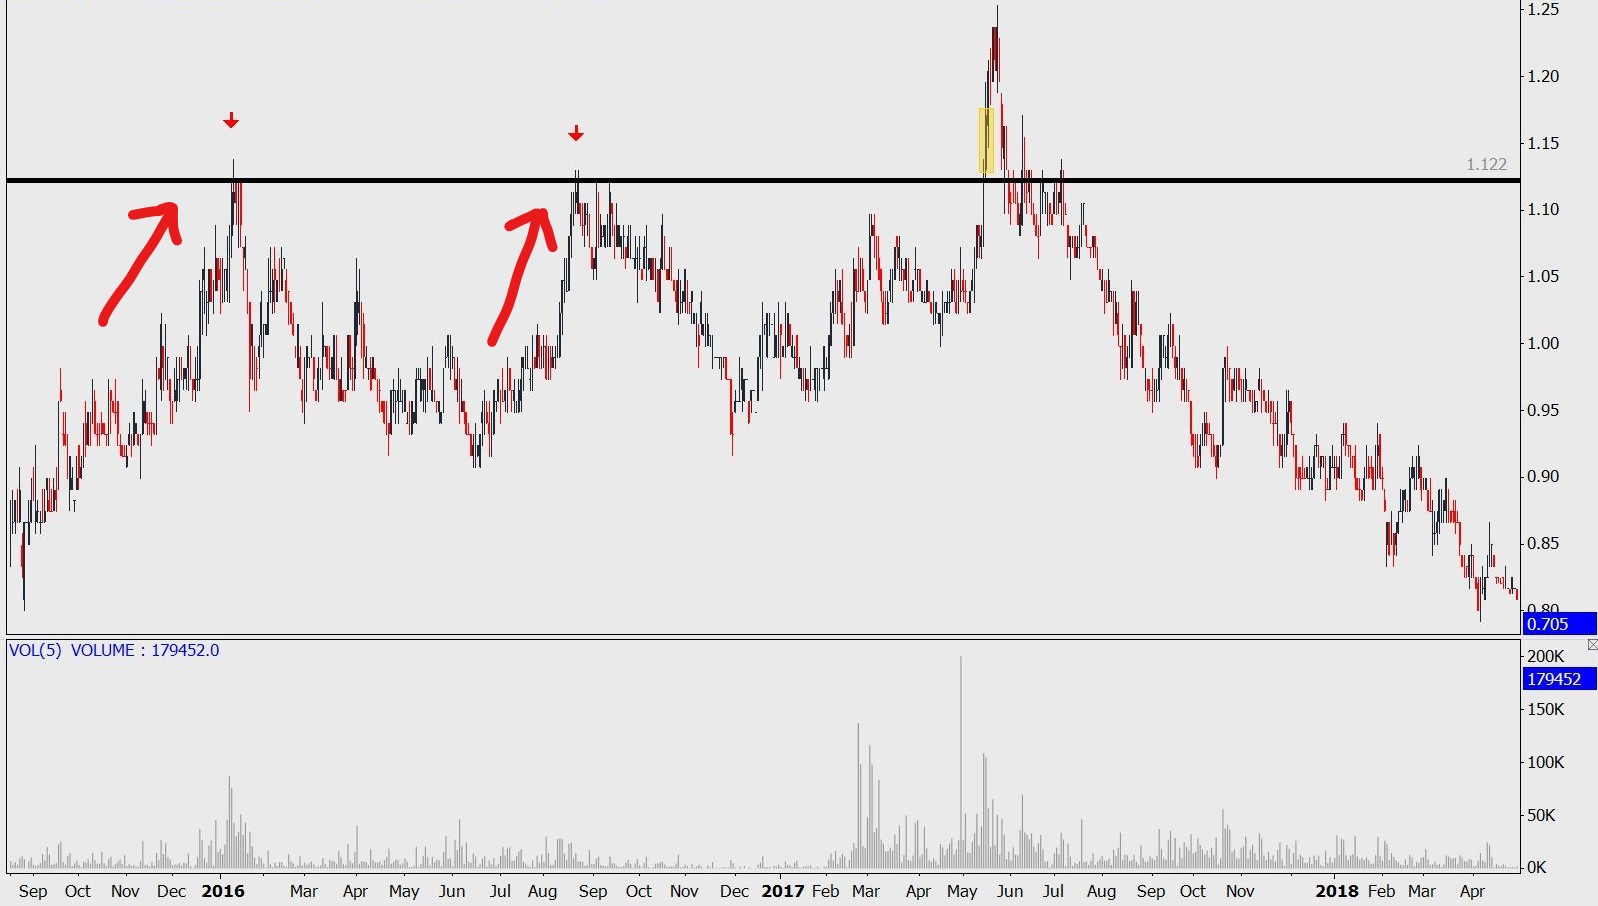
Buyers will dry out if the big boys continue on with the above operation and big boys would have distributed the majority of their shares, leaving a small holding in hand. This is when they create the resistance breakout by “demand”. These moves will give retail investors confidence that the stock is going into a bull trend & will Fear-Of-Missing-Out again!
The big boys don’t have to throw the price down like the previous round, because they don’t have to distribute the number of shares like they used to hold.
Example :
Big boys total holding 1,000,000 units of shares, 80% of the shares (800,000 units) are sold at the previous resistance. With 800,000 units of shares, they distribute 4 times which means each time they sell 200,000 units of shares.
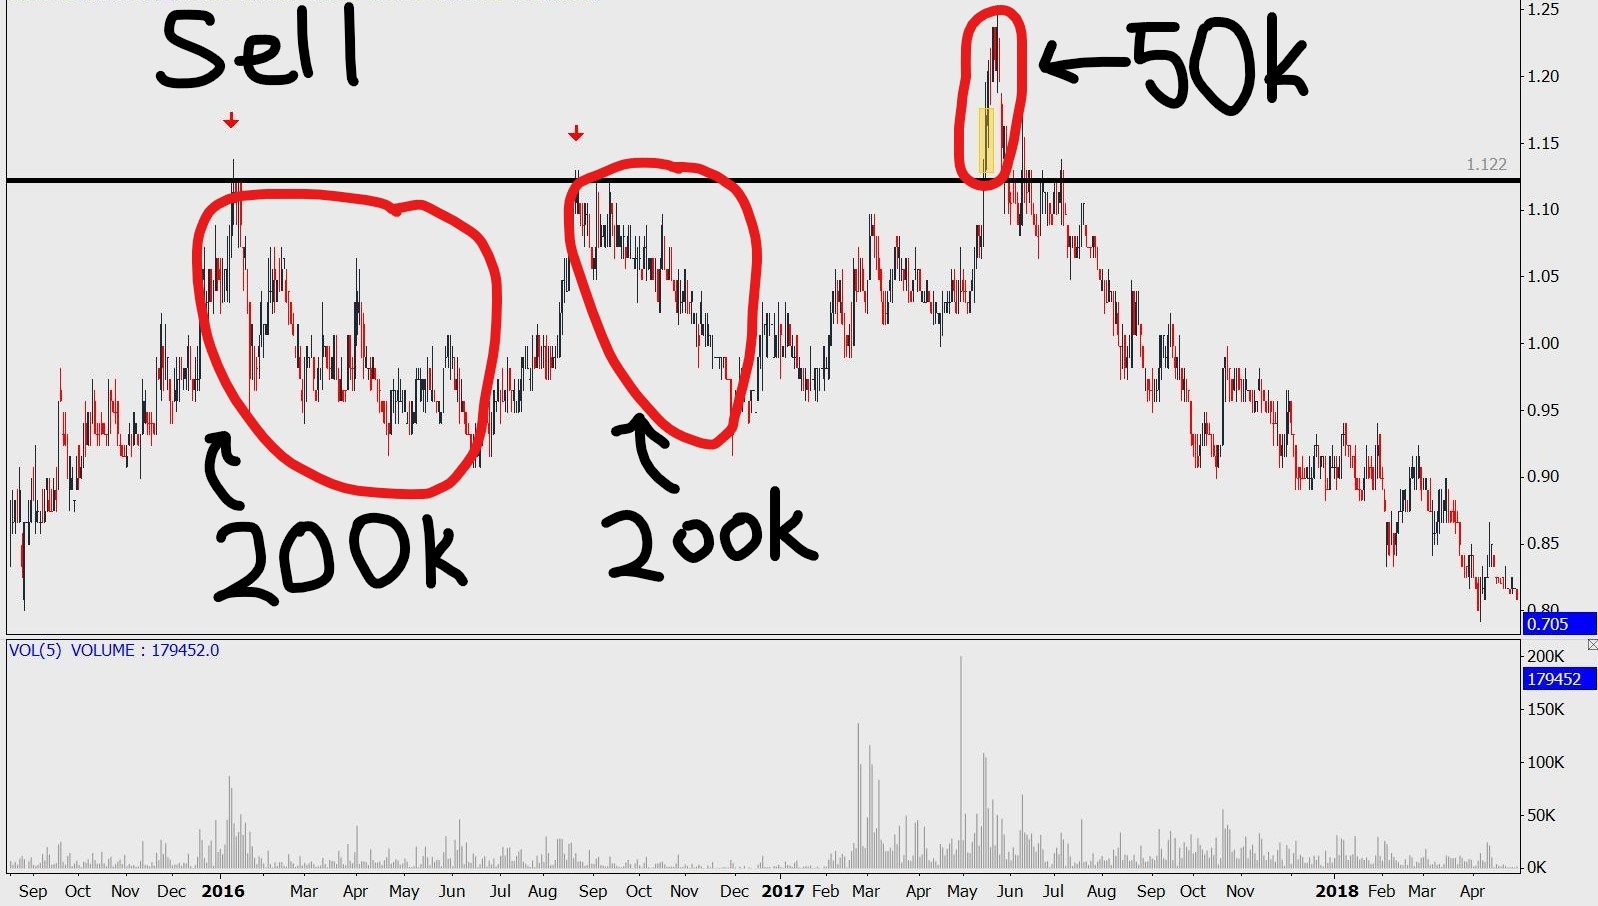
Compared to 20% of 1,000,000 shares is 200,000 units. If they distribute 4 times, each time they are selling 50,000 units only.
That’s why they don’t have to sell the shares to a much lower price and causes retrace. Because the volume that they are selling is lower. They can sell within the day while spending a small cost to maintain the price at the high side to give investors confidence that this stock is bullish, it closed near to the day high.
This is the reason behind how resistance is formed and we believe the creator of drawing resistance lines understands really well how these resistances are formed. But this knowledge is not passed down correctly & is simplified through generations, end up traders & investors learned only the cover of the book but don’t really understand the reasons, intentions, & the main components of this analysis.
Now you know how resistance is formed & why breakouts don’t really work in the market anymore. So learn the right way to trade in the stock market, invest your time in understanding the stock market big boys.
Upcoming Webinar:

Advance Technical Analysis: Identify Price Continuation After Price Rebound
"Does losing money in the market crash experience still haunt you? Causing hesitation to enter into a stock while worrying whether the stock price will fall after your entry.
We will be sharing the price & volume movement with a 5 min chart that shows the stock price will continue to move higher in this webinar. With our analysis, you can identify whether the stock price will continue to markup higher & avoid “Pump-n-Dump” stocks."
Date :
SUN OCT 23 7:30PM
MON OCT 24 8:30PM
WED OCT 26 8:30PM
Registration Link: https://attendee.gotowebinar.com/register/902857802328269070
You may find out more about understanding the big boys with our explanation videos at the link below :
To find out more about our Operator Analysis Pro-Trader Course, visit this link : https://bit.ly/3NVMHfS
Website : www.roundnsurge.com
Facebook: www.facebook.com/roundnsurgeofficial
Youtube: www.youtube.com/c/RoundSurgeoperatoranalysis
Instagram: @roundnsurge
Kelvin's Instagram: @kelvinnny810
Malaysia stock market is a unique market, hence it requires a customized trading approach to tackle & swerve. Many existing traders in Malaysia apply a plug-and-play strategy from the overseas stock market, but it is not necessarily the best strategy to trade in KLSE. This is due to the difference in local and overseas stock market regulation and the size of market participants of institutional funds & retail investors.
“True traders react to the market.” is the backbone of our trading method. Our findings and strategies are developed through years of trading experience and observance of the operating style in Malaysia’s stock market.
Trading Account Opening
They are offering an IntraDay trade brokerage rate at 0.05% or RM8 whichever is higher for day trading stocks RM 50,000 & above-transacted volume (buy sell the same stocks on the same day). Buy & hold at 0.08%or RM8 whichever is higher.
Open a cash account now at the link below :
https://registration.mplusonline.com/?ref-id=R311
As Kelvin’s trading client, you will be exclusively invited to join Kelvin’s weekly webinar and telegram group. Click here to join.
For more inquiry contact him by email: kelvinyap.remisier@gmail.com or 019-5567829
If we have missed out on any important information, feel free to let us know and feel free to share this information out but it will be much appreciated if you can put us as the reference for our effort and respect, thank you in advance!
This blog is for sharing our point of view about the market movement and stocks only. The opinions and information herein are based on available data believed to be reliable and shall not be construed as an offer, invitation or solicitation to buy or sell any securities. Round & Surge and/or its associated persons do not warrant, represent, and/or guarantee the accuracy of any opinions and information herein in any manner whatsoever. No reliance upon any parts thereof by anyone shall give rise to any claim whatsoever against Round & Surge. It is not advice or recommendation to buy or sell any financial instrument. Viewers and readers are responsible for your own trading decision. The author of this blog is not liable for any losses incurred from any investment or trading.
More articles on Round & Surge Operator Analysis
Understanding Support and Resistance through Big Boys Demand and Supply
Created by roundnsurge | Aug 09, 2023
"Master Support & Resistance: Trade Hang Seng with Big Player Insights. Learn to spot levels using price & volume analysis. Trade smarter, minimize risks. Watch YouTube for examples.
Maximize day trading potential returns 10%-50% a day [ Hang Seng Index : CBBC VS. STRUCTURED WARRANTS ]
Created by roundnsurge | Jun 27, 2023
Discover the differences between Callable Bull/Bear Contracts (CBBCs) and structured warrants on the Hang Seng Index (HSI) to maximize your day trading returns.
Why Traders Are Switching to CBBCs from Stocks, CFD Forex, Cryptocurrency, and Futures Contracts
Created by roundnsurge | May 22, 2023
Discover the incredible profit potential of Callable Bull/Bear Contracts (CBBC). The ability to profit in rising and falling markets, and lower entry barriers make CBBC the superior choice for trader.
The Shortcut to Success: Short-Term Trading Strategies for KLSE and SGX
Created by roundnsurge | Apr 17, 2023
Identify profitable rebound stocks by following big players' support during downtrends & retracement understanding their marking of price levels in this short-term trading strategy for KLSE & SGX.

Boost Your Income With Trading: Building for the Future vs. Living for the Now
Created by roundnsurge | Apr 05, 2023
Unlock your financial potential with investment and trading strategies for building current and future income.
From Losses to Consistent Profits: An Insider's Guide to Overcoming Trading Experience in the Stock Market
Created by roundnsurge | Feb 04, 2023
Being able to accept our losses is the first step in being able to learn from them and turn that into future profit!
KLSE Day Trading | How to read big boys transaction to make profit | R&S Training class [Cut Scene]
Created by roundnsurge | Jan 29, 2023
We're going to give you an insider's look at how the big boys get their info and make trades, so that you can do it too!

Trading Technique To Find Best Entry & Exit for 2023 Top Stocks
Created by roundnsurge | Jan 12, 2023
We can’t avoid big boys in the stock market, so we learn how they operate & take advantage of their price movement for our better entry & exit.
Discussions
Be the first to like this. Showing 0 of 0 comments
Post a Comment
Featured Posts


Latest Videos


Apps


Top Articles
1
2
3
TA Sector Research
4
Good Articles to Share
What’s behind the slew of restaurant bankruptcies in 2024? Experts unpack the problems
5
Good Articles to Share
6
M+ Online Research Articles
7
Good Articles to Share
Four convicted in Spain over homophobic murder that sparked nationwode protests
8
MQ Market Updates
#
Stock
Score
Daily Stocks
Stock Name
Last
Change
Volume
Stock Name
Last
Change
Volume
Stock Name
Last
Change
Volume
MQ Trading Signals
Stock
Time
Signal
Duration
Stock
Time
Signal
Duration
Featured Advertisers / Partners


Ride The Bull Short The Bear
CS Tan
4.9 / 5.0
This book is the result of the author's many years of experience and observation throughout his 26 years in the stockbroking industry. It was written for general public to learn to invest based on facts and not on fantasies or hearsay....