


Round & Surge Operator Analysis
The Flaws of Moving Average Line

roundnsurge
Publish date: Tue, 28 Sep 2021, 03:32 PM
roundnsurge
0 59
"True trader react to the market" is the core of our Operator analysis. Operator Analysis analyze the price and volume of the big boys in equity market, where we currently using our analysis in gold market, Bitcoin and Malaysia market.
We will be sharing education material here such as to become a successful trader & investor, corporate action explanation, the financial instrument in the market you can utilize for your investment and more. We are here to help you understand the stock market.
We will be sharing education material here such as to become a successful trader & investor, corporate action explanation, the financial instrument in the market you can utilize for your investment and more. We are here to help you understand the stock market.

Do you understand how indicators work and what they are tracking? It is to show us the current trend based on the average price of long term & short term or volatility of a particular stock, based on the price movement and/or the volume.
However, the indicator will start pointing the other way, if there is a sudden huge movement in the price. This always confuses many investors & traders, not knowing which direction the indicator is pointing at.
For example, Moving Average (MA) is a common indicator used by many traders to justify a reversal of a price trend. It is often used together with short term 50 MA & long term 200 MA to find out “The Golden Cross” and “The Dead Cross”, which means a confirmation of trend reversal.
Let us point out a few questions that many traders will face when applying MA lines crossed for your investment decision.
1. How do we confirm that the short-term MA has successfully crossed long term MA?2. What if the short-term MA crosses the other way after it has a confirmation?
How do we confirm that the short-term MA has successfully crossed long term MA?
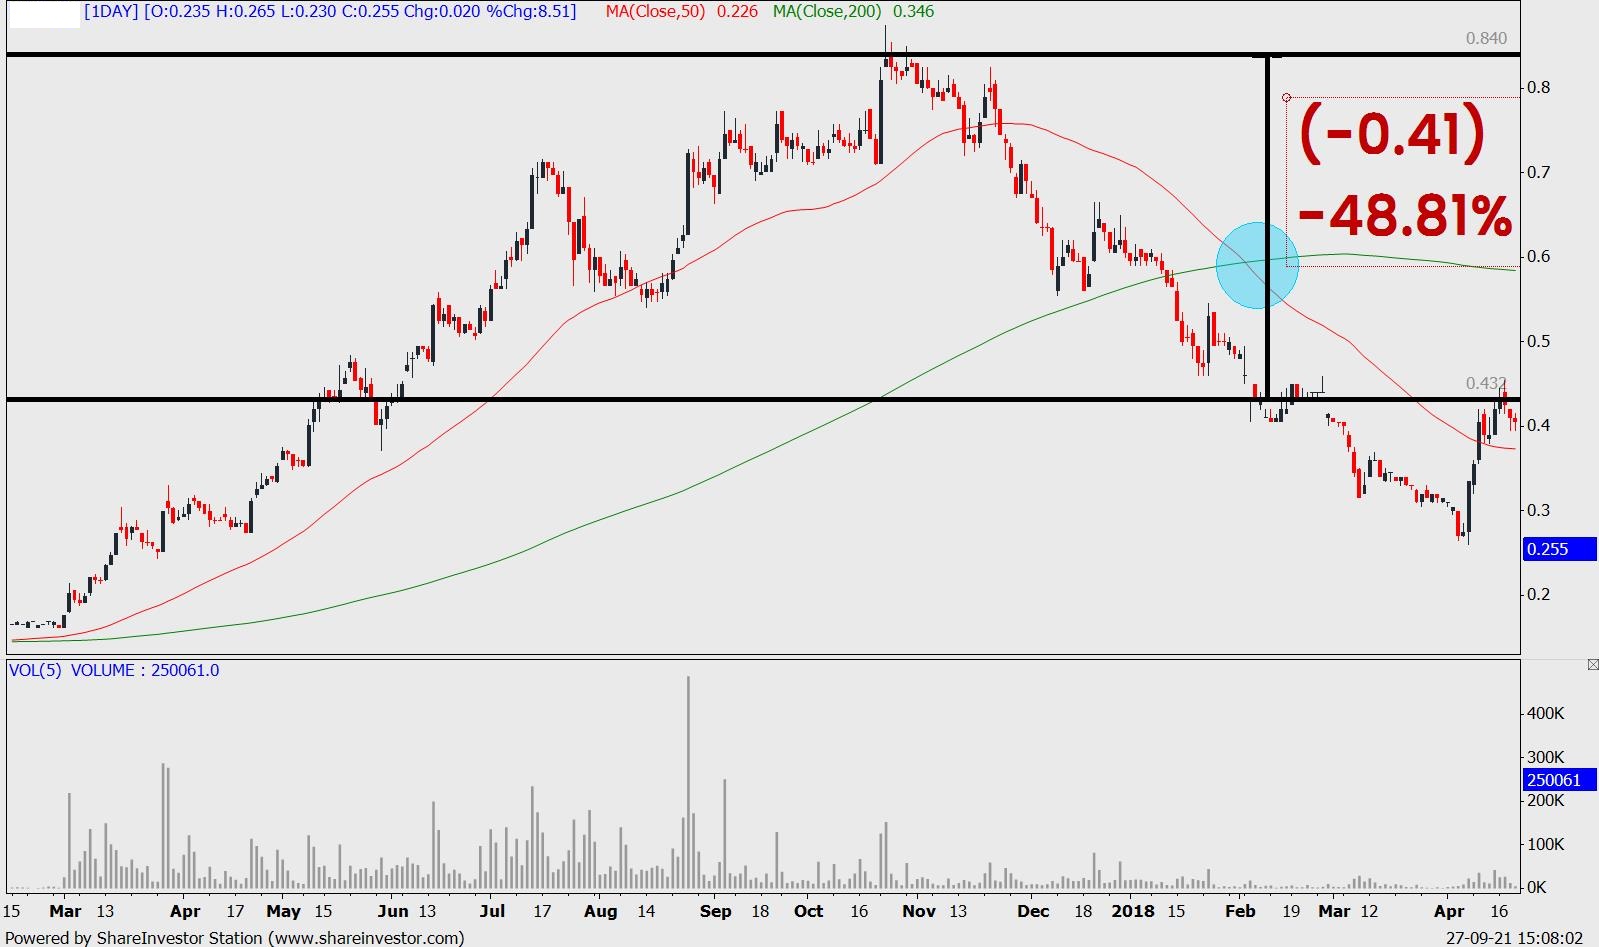
In the above chart, the red line is 50MA, green line is 200MA.
Based on the information we can get about Moving Average Dead cross or golden dead cross, the confirmation is often when the short-term MA crosses the long term MA (blue circle). If you are following this confirmation for exit. You might have lost (-48.81%) from the highest closing price.
Or we can add on another Exponential Moving Average (EMA) which is more sensitive to the price fluctuations (is still based on the average price of the stock) like the chart below for earlier exit.
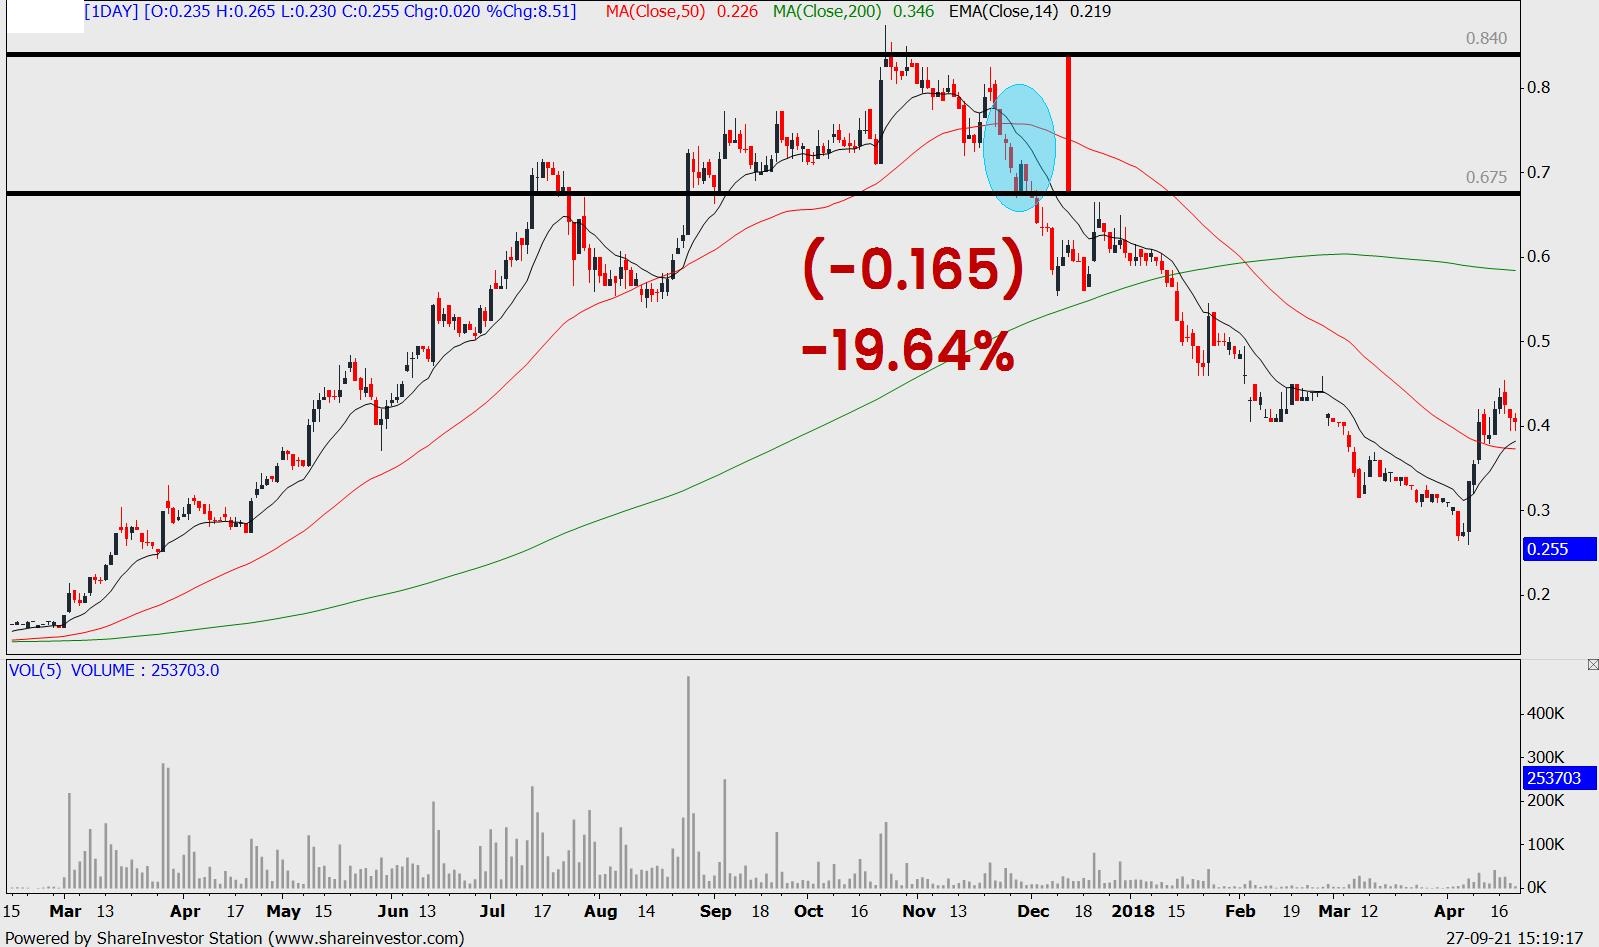
By the time the EMA confirmed it is crossing down 50 MA, the price will be closing at 0.675. Your losses are further reduced to -19.64%, which is still quite a huge loss for some traders.
The reason why the lines cross later is because the Moving Average is using the average stock price of X no. of days. The shorter the time frame you set for your MA the more sensitive it is to the price change. Which means, applying MA to decide the exit or entry for your investment will always be a few steps later than analysing the price action.
As an investor or trader, we want to know the intention of the big boys. In order for us to follow the “Market” AKA the big boy, the most direct signal of knowing the big boys’ intention is through the price volume actions. By analysing the transaction data done by the big boys and understanding their intention to distribute shares that will cause a trend reversal. Instead of following the moving average which derives from the average price. Unless there is a huge price movement, or else the MA line will not cross immediately. Which is also too late for your exit, because the price has dropped lower.
That also contributes to why investors & traders are reluctant to cut loss or exit when there's a dead cross. Because the losses are huge or miss out on the profit opportunity earlier and it is too painful to cut losses or exit. And they end up holding the stock & apply “Hope Analysis”.
If you feel the same about Moving Average and wish to find out more about how big boys operate in the stock market, you may head to our YouTube Channel or FB page to watch the videos we posted about big boys in the stock market. Or you can also go to our 6 months training course’s landing page link to watch the details explanation of big boys
What if the short-term MA crosses the other way after it has a confirmation?
Having the right setting for Moving Average (MA) is always the problem faced by many investors and traders. If it is set to be too sensitive (shorter days), the MA line will often cross up & down easily, causing confusion to investors on whether the MA cross is confirmed. If it is less sensitive (longer days), then the decision to exit is too late and causes huge losses or misses out huge profits like what we have shared earlier in this post.
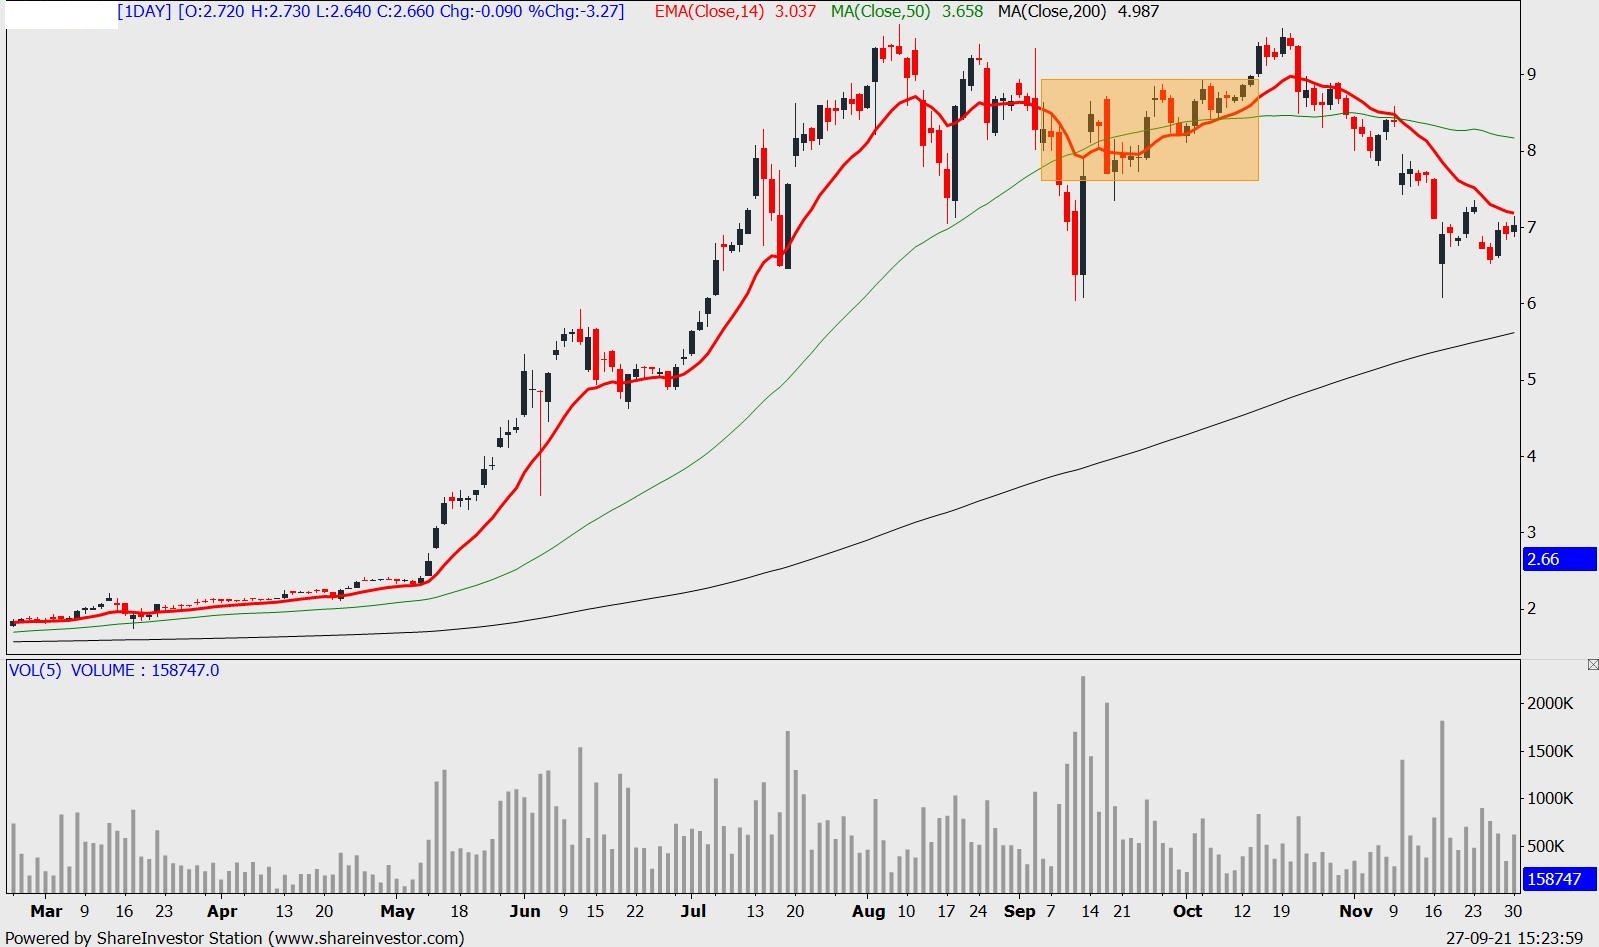
Like the chart above, short term EMA crosses down (Orange box) on the huge price drop. Then it crosses back up again and crosses down again later. If you exit at the first cross down with the huge price drop. You would have lost a huge amount of profit or losses and would feel regret right after the rebound.
From the above you can see that traders & investors are often knowing all the reversal too late because the tools that they use to analyse stocks are slow by nature. Not just indicators that show signs of laggy, chart patterns too. You may look at the live stream we did with xifu.my in FB to find out more about why chart patterns & resistance breakout is a late entry for all traders in this link .
These are the problems why retail investors are not able to achieve consistent profit from the stock market. Because the analysis that retail investors apply is too slow for them to make decisions to maximize their potential profits in their investment.
That’s why we have thrown all our Technical Analysis away & adopted following the big boys in the stock market by analysing the price & volume data to gauge the intention of the big boys. Starting from their accumulation and exit when the price volume action shows that they have distributed the majority of their shareholding. When the big boys have lesser shares in hand, it means that they are not going to mark up the price and they will soon sell their shares into the market and cause a price fall or a trend reversal.
The main difference between following big boys and using the traditional analysis (chart patterns, indicators), you know the price reversal is coming soon with Operator Analysis and for TA you know it after the price fall.
- When you understand the big boys, you will know they have distributed the majority of the share & the price will soon start to reverse.
- Apply indicators or chart patterns: you will notice the trend reverse when the price starts to fall (causing MA line or indicators to cross lower / support broken).
This is the reason why many traders & investors are always looking for the right strategies or setting for their Technical Analysis. There is nothing wrong with the setting or the combination of your indicators and chart pattern strategy. It is because the analysis itself is not applicable to the current market.
Watch the videos in the link to understand how big boys work: https://bit.ly/2Velj7k
Understanding big boys: https://bit.ly/roundnsurge
Website: www.roundnsurge.com
Facebook: www.facebook.com/roundnsurgeofficial
Youtube: www.youtube.com/c/RoundSurgeoperatoranalysis
Instagram: @roundnsurge
Kelvin's Instagram: @kelvinnny810
Malaysia stock market is a unique market, hence it requires a customized trading approach to tackle & swerve. Many existing traders in Malaysia apply a plug-and-play strategy from the overseas stock market, but it is not necessarily the best strategy to trade in KLSE. This is due to the difference in local and overseas stock market regulation and the size of market participants of institutional funds & retail investors.
“True traders react to the market.” is the backbone of our trading method. Our findings and strategies are developed through years of trading experience and observance of the operating style in Malaysia’s stock market.
Trading Account Opening
They are offering an IntraDay trade brokerage rate at 0.05% or RM8 whichever is higher for day trading stocks RM 50,000 & above-transacted volume (buy sell the same stocks on the same day). Buy & hold at 0.08%or RM8 whichever is higher.
Open a cash account now at the link below:
https://registration.mplusonline.com/?ref-id=R311
As Kelvin’s trading client, you will be exclusively invited to join Kelvin’s weekly webinar and telegram group. Click here to join.
For more inquiry contact him by email: kelvinyap.remisier@gmail.com or 019-5567829
If we have missed out on any important information, feel free to let us know and feel free to share this information out but it will be much appreciated if you can put us as the reference for our effort and respect, thank you in advance!
This blog is for sharing our point of view about the market movement and stocks only. The opinions and information herein are based on available data believed to be reliable and shall not be construed as an offer, invitation or solicitation to buy or sell any securities. Round & Surge and/or its associated persons do not warrant, represent, and/or guarantee the accuracy of any opinions and information herein in any manner whatsoever. No reliance upon any parts thereof by anyone shall give rise to any claim whatsoever against Round & Surge. It is not advice or recommendation to buy or sell any financial instrument. Viewers and readers are responsible for your own trading decision. The author of this blog is not liable for any losses incurred from any investment or trading.
More articles on Round & Surge Operator Analysis
Understanding Support and Resistance through Big Boys Demand and Supply
Created by roundnsurge | Aug 09, 2023
"Master Support & Resistance: Trade Hang Seng with Big Player Insights. Learn to spot levels using price & volume analysis. Trade smarter, minimize risks. Watch YouTube for examples.
Maximize day trading potential returns 10%-50% a day [ Hang Seng Index : CBBC VS. STRUCTURED WARRANTS ]
Created by roundnsurge | Jun 27, 2023
Discover the differences between Callable Bull/Bear Contracts (CBBCs) and structured warrants on the Hang Seng Index (HSI) to maximize your day trading returns.

Why Traders Are Switching to CBBCs from Stocks, CFD Forex, Cryptocurrency, and Futures Contracts
Created by roundnsurge | May 22, 2023
Discover the incredible profit potential of Callable Bull/Bear Contracts (CBBC). The ability to profit in rising and falling markets, and lower entry barriers make CBBC the superior choice for trader.
The Shortcut to Success: Short-Term Trading Strategies for KLSE and SGX
Created by roundnsurge | Apr 17, 2023
Identify profitable rebound stocks by following big players' support during downtrends & retracement understanding their marking of price levels in this short-term trading strategy for KLSE & SGX.

Boost Your Income With Trading: Building for the Future vs. Living for the Now
Created by roundnsurge | Apr 05, 2023
Unlock your financial potential with investment and trading strategies for building current and future income.

From Losses to Consistent Profits: An Insider's Guide to Overcoming Trading Experience in the Stock Market
Created by roundnsurge | Feb 04, 2023
Being able to accept our losses is the first step in being able to learn from them and turn that into future profit!
KLSE Day Trading | How to read big boys transaction to make profit | R&S Training class [Cut Scene]
Created by roundnsurge | Jan 29, 2023
We're going to give you an insider's look at how the big boys get their info and make trades, so that you can do it too!

Trading Technique To Find Best Entry & Exit for 2023 Top Stocks
Created by roundnsurge | Jan 12, 2023
We can’t avoid big boys in the stock market, so we learn how they operate & take advantage of their price movement for our better entry & exit.
Discussions
Be the first to like this. Showing 0 of 0 comments
Post a Comment
Featured Posts


Latest Videos


Apps


Top Articles
1
2
3
TA Sector Research
4
Good Articles to Share
What’s behind the slew of restaurant bankruptcies in 2024? Experts unpack the problems
5
Good Articles to Share
6
M+ Online Research Articles
7
Good Articles to Share
Four convicted in Spain over homophobic murder that sparked nationwode protests
8
MQ Market Updates
#
Stock
Score
Daily Stocks
Stock Name
Last
Change
Volume
Stock Name
Last
Change
Volume
Stock Name
Last
Change
Volume
MQ Trading Signals
Stock
Time
Signal
Duration
Stock
Time
Signal
Duration
Featured Advertisers / Partners


Ride The Bull Short The Bear
CS Tan
4.9 / 5.0
This book is the result of the author's many years of experience and observation throughout his 26 years in the stockbroking industry. It was written for general public to learn to invest based on facts and not on fantasies or hearsay....