


Round & Surge Operator Analysis
Trade Stock from Top Active/ Gainer List

roundnsurge
Publish date: Thu, 15 Sep 2022, 11:45 AM
roundnsurge
0 59
"True trader react to the market" is the core of our Operator analysis. Operator Analysis analyze the price and volume of the big boys in equity market, where we currently using our analysis in gold market, Bitcoin and Malaysia market.
We will be sharing education material here such as to become a successful trader & investor, corporate action explanation, the financial instrument in the market you can utilize for your investment and more. We are here to help you understand the stock market.
We will be sharing education material here such as to become a successful trader & investor, corporate action explanation, the financial instrument in the market you can utilize for your investment and more. We are here to help you understand the stock market.
One of the easiest ways for new investors to find stocks is through the most active stocks or the biggest gainers. Think this is the easiest way to find profitable trades, as the stocks on these lists are very active during the day and we always think a lot of people are buying the stocks on the most active lists.
In fact, this practice is exactly the same as buying on the news. Big boys get publicity in the market and are able to grab the attention of retail investors. Why do big boys need your attention? Just like Tesla and Apple, ads need to be created to attract more customers to buy their products to generate profits. In the stock market, their products are stocks.
Top active, top gainers, & news are a great platform for them to gain retail investors' attention to buy their shares.
That's why we find that most of the stocks we pick from these lists are often trapped at high prices. Because the big boys succeeded in attracting enough investors to queue up to buy at a lower buying price. This is where they cancel their buy orders at the market depth and sell them to investors who parked buy orders at lower prices. Retail investors, on the other hand, thought they bought the shares on the cheap.
Therefore, we need to be very careful in selecting stocks on the active list, not all stocks will show higher prices. Most of the gainers on the most active list are here to entice us to buy big boy stocks. Especially those stocks that have technical buy signals.
We have a different way of analysis when selecting stocks from the top active list.
Those price and volume movements that show the big boys are creating activity to attract buyers won't have the potential to rise in the next few days. This trading pattern suggests that they have enough investors lining up with lower bid prices for them to profit by selling them shares.
There are some stocks that offer trading opportunities, but we prefer to day trade these stocks. Because these stocks on the most active list usually trade at their peak, in other words, the big boys are ready to dump these stocks on the market. It is not wise to invest in these stocks for the medium or long term. Now that you know that the big guys are going to sell it, why do you still hold it?
Let's take a look at some of the examples below to determine which price and volume movements indicate that the big boys have no intention of increasing prices after the stock was placed on the top active list. Then we'll look at price and volume movements that have trading opportunities.
Creating false buying activity
What we see in the stock market may not be true. Humans usually choose the easiest way to make a decision. When you want retail investors to buy your stocks, you need to make them easier for them to see. This information must have direct implications for investors to make purchasing decisions. For example, the daily buy percentage for a stock is the total number of buy trades completed in a single day. Many investors will assume that a higher buy percentage means more demand or more bullishness. Because a lot of people buy it.
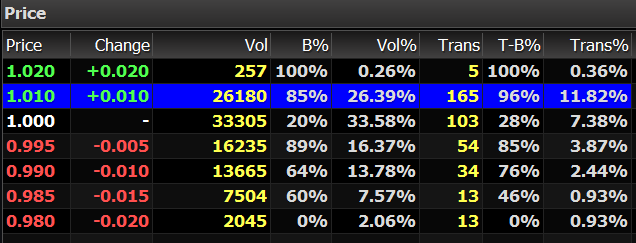
This is not always the case, a purchase transaction can be created by buying from the left and then buying back from the left with the right. When we say "change hands", we mean that the purchase transaction was created by the same group of people.
Another reason this isn't a good indicator of high demand flowing into stocks is that it's just data that tells us what happened before, but it doesn't tell us what's going to happen later.
When the big boys jack up prices, buying pressure can arise. When enough investors get into these stocks, the price will peak. The big boys will start to sell the stock and drop to a lower price, then increase the selling percentage.
This is why many traders and investors are confused about the analysis they apply to KLSE, especially traditional technical analysis. Because data collected for an indicator or resistance line from previous price highs or lows only shows what happened at that time. But that doesn't tell us what the big boy's next move is. This has caused many traders and investors to get caught up in technical entry signals.
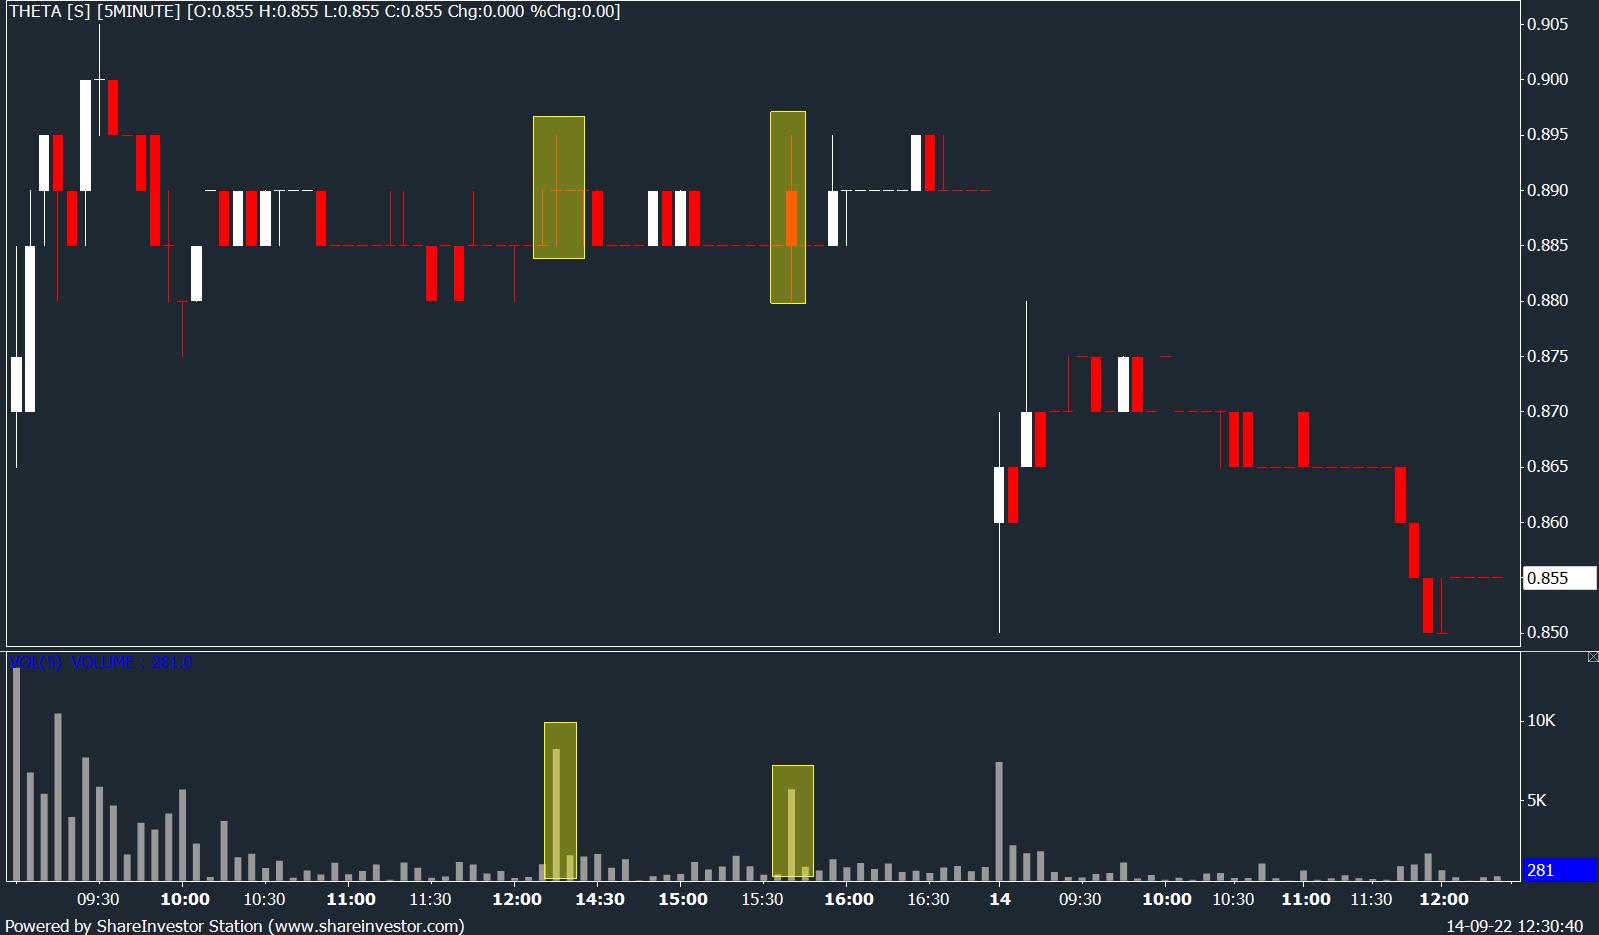
False buying activity in 5 mins chart
By understanding the intention of every price trend of the big boys, you can know the next price trend. Why do they increase the price? Why doesn't the price go up when the quantity is large?
The basic laws of stock market prices and quantities are:
- High volume, high prices = bullish
- High volume and generally falling prices = bearish
Everyone knows this basic price and quantity very well, but we need to analyze more details to find out where the quantity is created. To know this, we need to look at the 5-minute chart to see when the volume is coming.
In the 5-minute chart, when the volume is large and the price increase is not large, it means that the big boys have no plans to increase the price. That's because they attract enough buyers to wait for the stock at the lower bid price.
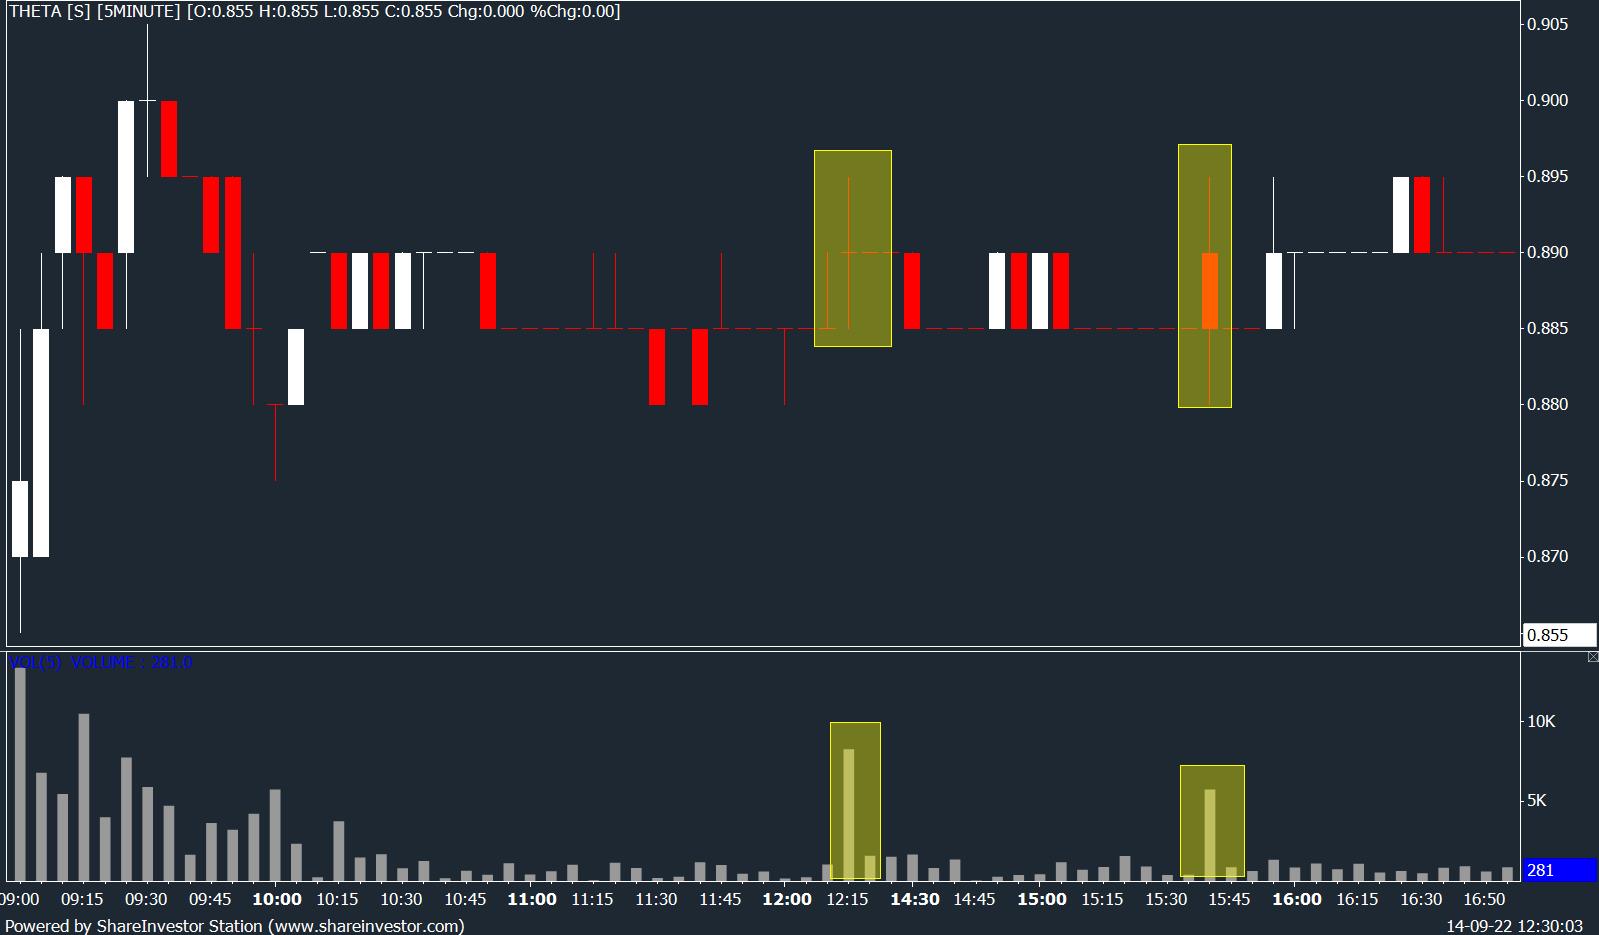
There is no need to push prices higher, but they need to create an impulse for investors, which is FOMO [Fear-Of-Missing-Out]. Convince them that there seems to be a lot of buying flowing into the stock. But the price won't be higher.
This price action tells us that the big boys are not going to push the price further and it is not going to stay high the next day. The next day will be when they start harvesting or realize a profit by dumping the stock to buyers who park at a lower price.
When you are fully aware of these price and volume movements, you can avoid stocks entering peak trading periods. This will help you reduce trading mistakes and avoid losing trades. Then we look at how to profit from the stock market by following the big boys.
True price up
The opportunity we seize is when the bigwigs want to increase their prices to attract buyers with high prices.
This usually happens when the big boys find that not many buyers are lining up on lower-pay orders. Then they'll start raising prices to draw investors' attention to the stocks they're in.
Before they increase their price, we need to understand how the big boys work and how the price and movement are going. So we can prepare to get in when they start pumping up the price, and when they're going to sell, we can get out.
You can find out more about the new technical analysis to find trading opportunity stocks on KLSE's most active list in the blog post link below:
Upcoming Webinar:

Advance Technical Analysis: Identify Price Continuation After Price Rebound
"Does losing money in the market crash experience still haunt you? Causing hesitation to enter into a stock while worrying whether the stock price will fall after your entry.
We will be sharing the price & volume movement with a 5 min chart that shows the stock price will continue to move higher in this webinar. With our analysis, you can identify whether the stock price will continue to markup higher & avoid “Pump-n-Dump” stocks."
Date :
SUN OCT 23 7:30PM
MON OCT 24 8:30PM
WED OCT 26 8:30PM
Registration Link: https://attendee.gotowebinar.com/register/902857802328269070
Trade in KLSE: New Technical Analysis that Track the Big Boys' Next Move
Watched the recorded video here: https://www.roundnsurge.com/rs-member/course/104
Give us a LIKE to support our contribution if you find this blog helpful to you. Thank you!
Easy way to learn how big boys accumulate shares: https://bit.ly/3AOhUz1
Website: www.roundnsurge.com
Facebook: www.facebook.com/roundnsurgeofficial
Youtube: www.youtube.com/c/RoundSurgeoperatoranalysis
Instagram: @roundnsurge
Kelvin's Instagram: @kelvinnny810
Kelvin’s Twitter: @KelvinYap810
Malaysia's stock market is a unique market; hence it requires a customized trading approach to tackle & swerve. Many existing traders in Malaysia apply a plug-and-play strategy from the overseas stock market, but it is not necessarily the best strategy to trade in KLSE. This is due to the difference in local and overseas stock market regulation and the size of market participants of institutional funds & retail investors.
“True traders react to the market.” is the backbone of our trading method. Our findings and strategies are developed through years of trading experience and observance of the operating style in Malaysia’s stock market.
Trading Account Opening
They are offering an Intraday trade brokerage rate at 0.05% or RM8 whichever is higher for day trading stocks RM 50,000 & above-transacted volume (buy sell the same stocks on the same day). Buy & hold at 0.08%or RM8 whichever is higher.
Open a cash account now at the link below:
https://registration.mplusonline.com/#/?drCode=R311
As Kelvin’s trading client, you will be exclusively invited to join Kelvin’s weekly webinar and telegram group. Click here to join.
For more inquiries contact him by email: kelvinyap.remisier@gmail.com or 019-5567829
If we have missed out on any important information, feel free to let us know and feel free to share this information but it will be much appreciated if you can put us as the reference for our effort and respect, thank you in advance!
This blog is for sharing our point of view about the market movement and stocks only. The opinions and information herein are based on available data believed to be reliable and shall not be construed as an offer, invitation or solicitation to buy or sell any securities. Round & Surge and/or its associated persons do not warrant, represent, and/or guarantee the accuracy of any opinions and information herein in any manner whatsoever. No reliance upon any parts thereof by anyone shall give rise to any claim whatsoever against Round & Surge. It is not advice or recommendation to buy or sell any financial instrument. Viewers and readers are responsible for your own trading decision. The author of this blog is not liable for any losses incurred from any investment or trading.
More articles on Round & Surge Operator Analysis
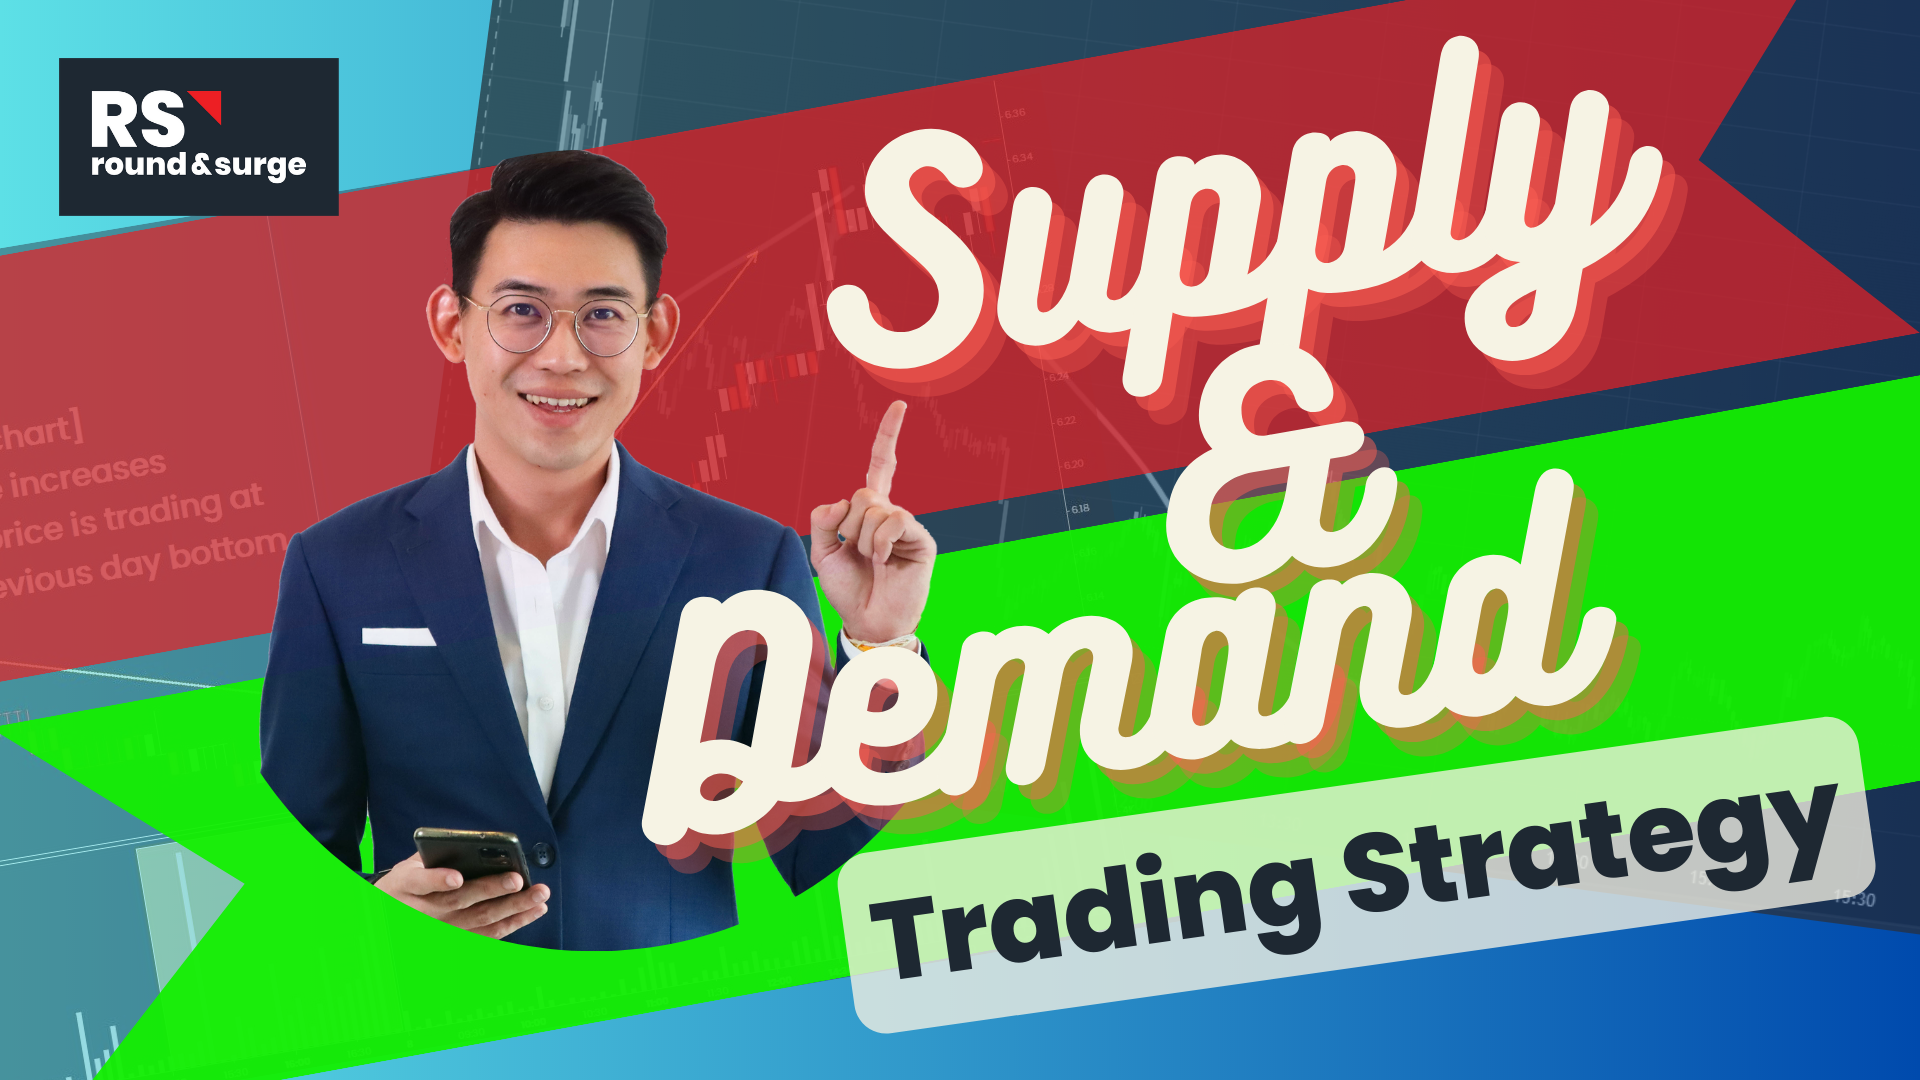
Understanding Support and Resistance through Big Boys Demand and Supply
Created by roundnsurge | Aug 09, 2023
"Master Support & Resistance: Trade Hang Seng with Big Player Insights. Learn to spot levels using price & volume analysis. Trade smarter, minimize risks. Watch YouTube for examples.
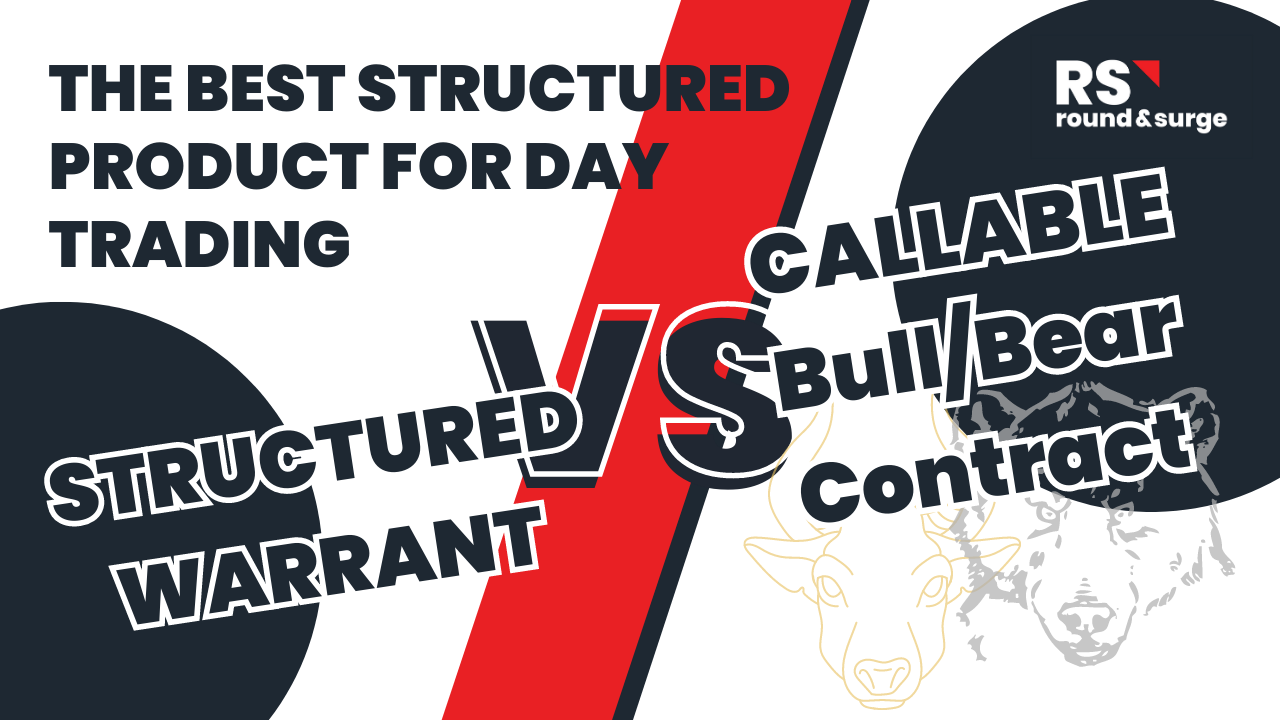
Maximize day trading potential returns 10%-50% a day [ Hang Seng Index : CBBC VS. STRUCTURED WARRANTS ]
Created by roundnsurge | Jun 27, 2023
Discover the differences between Callable Bull/Bear Contracts (CBBCs) and structured warrants on the Hang Seng Index (HSI) to maximize your day trading returns.
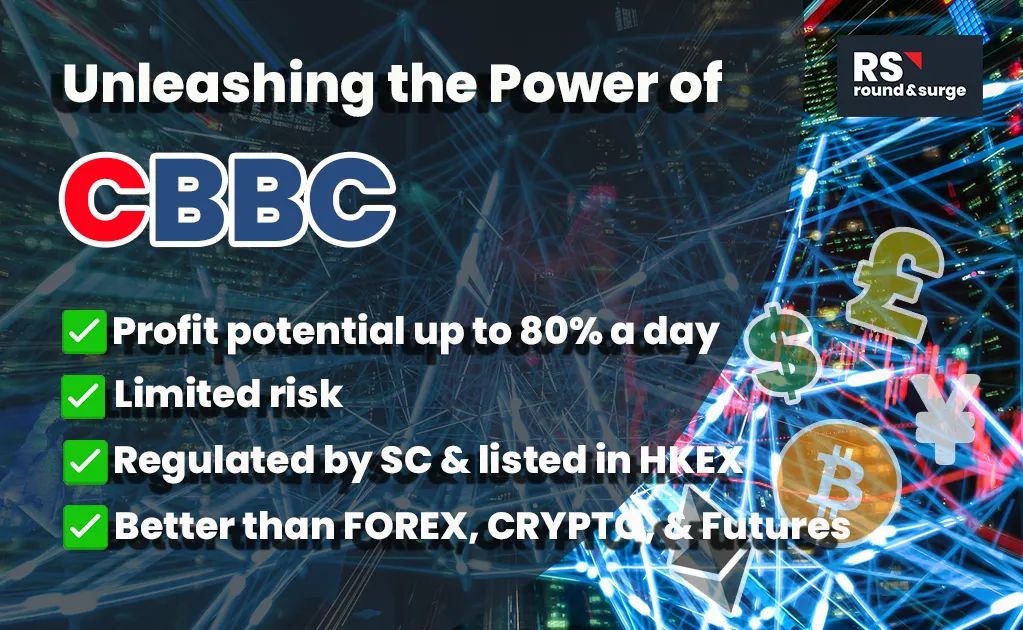
Why Traders Are Switching to CBBCs from Stocks, CFD Forex, Cryptocurrency, and Futures Contracts
Created by roundnsurge | May 22, 2023
Discover the incredible profit potential of Callable Bull/Bear Contracts (CBBC). The ability to profit in rising and falling markets, and lower entry barriers make CBBC the superior choice for trader.
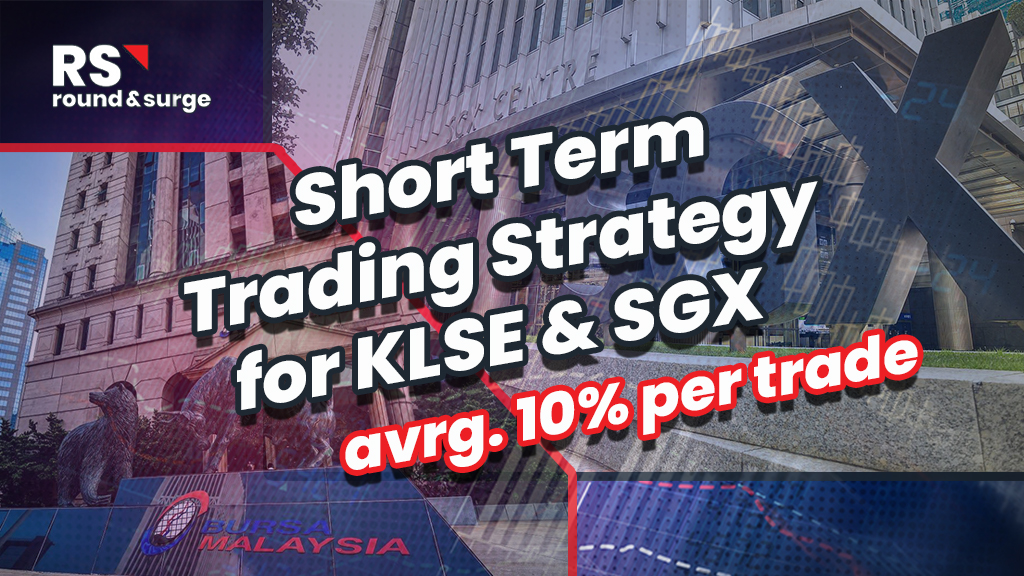
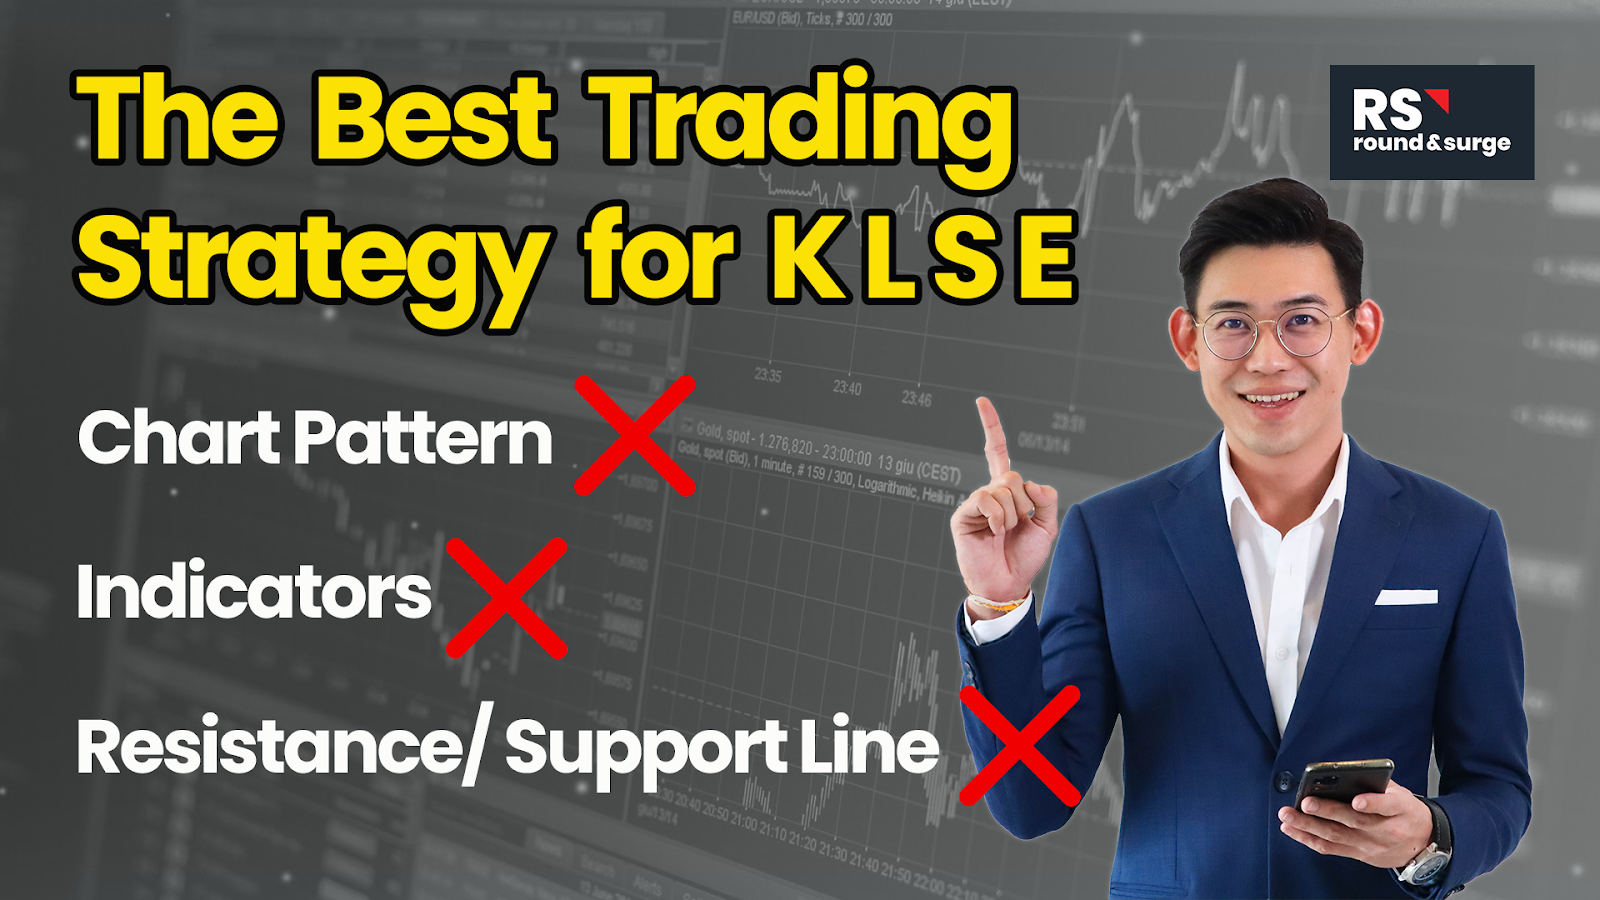
The Shortcut to Success: Short-Term Trading Strategies for KLSE and SGX
Created by roundnsurge | Apr 17, 2023
Identify profitable rebound stocks by following big players' support during downtrends & retracement understanding their marking of price levels in this short-term trading strategy for KLSE & SGX.

Boost Your Income With Trading: Building for the Future vs. Living for the Now
Created by roundnsurge | Apr 05, 2023
Unlock your financial potential with investment and trading strategies for building current and future income.
From Losses to Consistent Profits: An Insider's Guide to Overcoming Trading Experience in the Stock Market
Created by roundnsurge | Feb 04, 2023
Being able to accept our losses is the first step in being able to learn from them and turn that into future profit!
KLSE Day Trading | How to read big boys transaction to make profit | R&S Training class [Cut Scene]
Created by roundnsurge | Jan 29, 2023
We're going to give you an insider's look at how the big boys get their info and make trades, so that you can do it too!

Trading Technique To Find Best Entry & Exit for 2023 Top Stocks
Created by roundnsurge | Jan 12, 2023
We can’t avoid big boys in the stock market, so we learn how they operate & take advantage of their price movement for our better entry & exit.
Discussions
Be the first to like this. Showing 0 of 0 comments
Post a Comment
Featured Posts
Introducing MY's First IPO Fund for Sophisticated Investors!
New Update. Discover investment communities that resonate with your ideas
M & A Value Partners IPO Equity Fund has been launched - Targeted 13% Return p.a
Latest Videos


Apps


Top Articles
1
2
3
TA Sector Research
4
Good Articles to Share
What’s behind the slew of restaurant bankruptcies in 2024? Experts unpack the problems
5
Good Articles to Share
6
M+ Online Research Articles
7
Good Articles to Share
Four convicted in Spain over homophobic murder that sparked nationwode protests
8
MQ Market Updates
#
Stock
Score
Daily Stocks
Stock Name
Last
Change
Volume
Stock Name
Last
Change
Volume
Stock Name
Last
Change
Volume
MQ Trading Signals
Stock
Time
Signal
Duration
Stock
Time
Signal
Duration
Featured Advertisers / Partners


Ride The Bull Short The Bear
CS Tan
4.9 / 5.0
This book is the result of the author's many years of experience and observation throughout his 26 years in the stockbroking industry. It was written for general public to learn to invest based on facts and not on fantasies or hearsay....