


Icon8888 Gossips About Stocks
(Icon) Consumer Products - New Hoong Fatt, Niche Capital, Ni Hsin, NTPM

New Hoong Fatt
New Hoong Fatt Holdings Bhd (NHF) Snapshot
|
Open
2.50
|
Previous Close
2.50
|
|
|
Day High
2.50
|
Day Low
2.50
|
|
|
52 Week High
07/23/14 - 2.92
|
52 Week Low
12/16/14 - 2.26
|
|
|
Market Cap
187.9M
|
Average Volume 10 Days
18.0K
|
|
|
EPS TTM
0.14
|
Shares Outstanding
75.2M
|
|
|
EX-Date
12/5/14
|
P/E TM
17.9x
|
|
|
Dividend
0.11
|
Dividend Yield
4.80%
|


Consistent protiability over the years :-
Annual Result:
| F.Y. | Revenue ('000) | Profit Attb. to SH ('000) | EPS (Cent) | PE | DPS (Cent) | DY | NAPS | ROE (%) |
|---|---|---|---|---|---|---|---|---|
| TTM | 202,767 | 10,492 | 13.95 | 17.93 | 12.00 | 4.80 | 4.1700 | 3.35 |
| 2013-12-31 | 210,604 | 20,149 | 26.81 | 10.75 | 12.00 | 4.17 | 4.1700 | 6.43 |
| 2012-12-31 | 217,467 | 22,763 | 30.29 | 7.73 | 13.00 | 5.56 | 4.0300 | 7.52 |
| 2011-12-31 | 215,570 | 19,805 | 26.35 | 8.73 | 12.00 | 5.22 | 3.8500 | 6.84 |
| 2010-12-31 | 222,473 | 27,254 | 36.26 | 6.35 | 13.00 | 5.65 | 3.3200 | 10.92 |
| 2009-12-31 | 203,315 | 21,973 | 29.24 | 7.70 | 12.00 | 5.33 | 3.0800 | 9.49 |
| 2008-12-31 | 168,902 | 18,281 | 24.32 | 6.58 | 11.00 | 6.88 | 2.9000 | 8.39 |
| 2007-12-31 | 156,757 | 23,003 | 30.61 | 5.89 | 11.00 | 6.11 | 2.7600 | 11.09 |
| 2006-12-31 | 156,904 | 26,900 | 35.79 | 5.23 | 14.00 | 7.49 | 2.5600 | 13.98 |
| 2005-12-31 | 154,157 | 20,785 | 27.73 | 6.82 | 11.00 | 5.82 | 2.2200 | 12.49 |
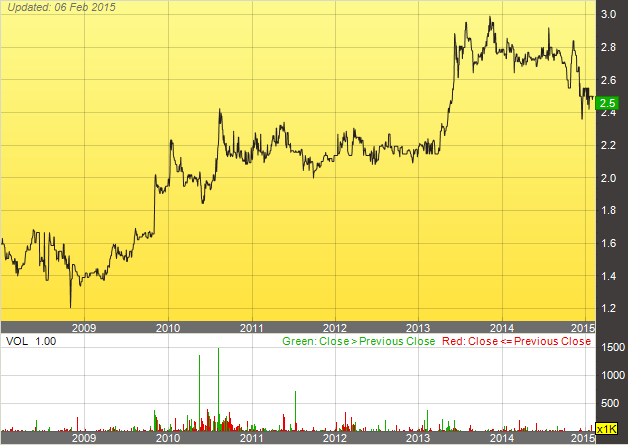
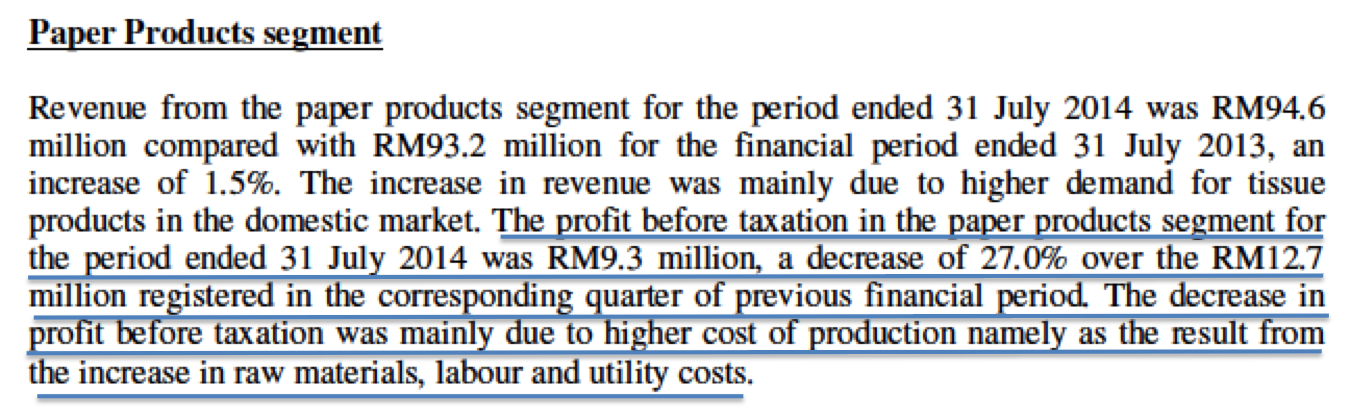
However, the group saw reduced profitability in 2014. For the first nine months of 2013, the group reported net profit of RM20 mil. However, in first nine months of 2014, total net profit was RM10.6 mil only, a decline of 50%.
Quarter Result:
| F.Y. | Quarter | Revenue ('000) | Profit before Tax ('000) | Profit Attb. to SH ('000) | EPS (Cent) | DPS (Cent) | NAPS |
|---|---|---|---|---|---|---|---|
| 2014-12-31 | 2014-09-30 | 50,249 | 4,293 | 2,589 | 3.44 | 3.00 | 4.1700 |
| 2014-12-31 | 2014-06-30 | 56,806 | 6,109 | 5,472 | 7.28 | - | 4.2300 |
| 2014-12-31 | 2014-03-31 | 45,951 | 3,492 | 2,480 | 3.30 | - | 4.1900 |
| 2013-12-31 | 2013-12-31 | 49,761 | 2,101 | -49 | -0.07 | 9.00 | 4.1700 |
| 2013-12-31 | 2013-09-30 | 51,592 | 7,427 | 5,505 | 7.32 | 3.00 | 4.2000 |
| 2013-12-31 | 2013-06-30 | 54,937 | 9,783 | 7,938 | 10.56 | - | 4.2300 |
| 2013-12-31 | 2013-03-31 | 54,313 | 8,047 | 6,755 | 8.99 | - | 4.1200 |
| 2012-12-31 | 2012-12-31 | 54,963 | 3,327 | 1,589 | 2.11 | 10.00 | - |
| 2012-12-31 | 2012-09-30 | 53,864 | 8,837 | 7,622 | 10.14 | 3.00 | 4.0400 |
| 2012-12-31 | 2012-06-30 | 54,622 | 9,835 | 9,457 | 12.58 | - | 4.0300 |
| 2012-12-31 | 2012-03-31 | 54,018 | 5,670 | 4,095 | 5.45 | - | 3.9000 |
Has been paying out dividend per share of 12 to 13 sen per annum over the years. This translates into yield of approximately 4.8%. With this years' lower profitability, can dividend payment be sustained ?
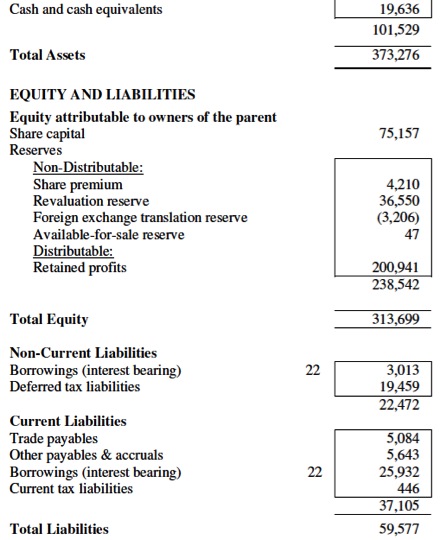
Strong balance sheets :-
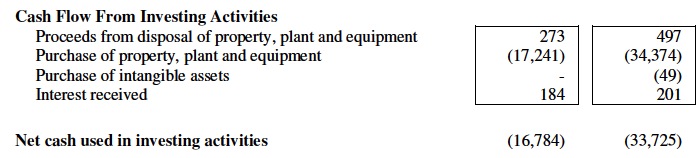
Occsaionally does need to invest in plants and machineries :-
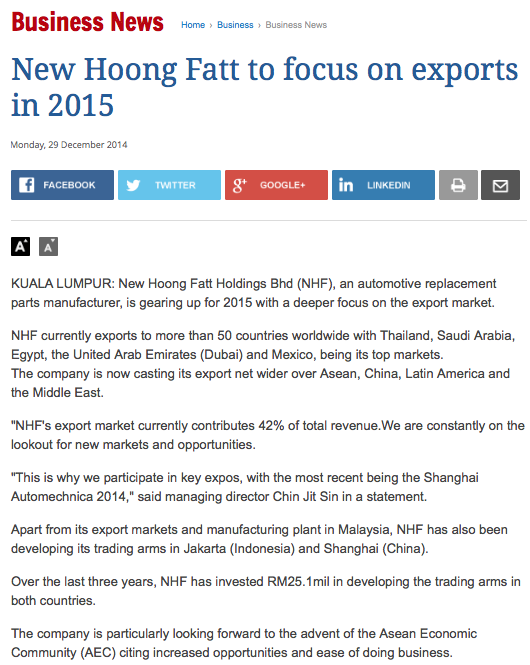
Exports closed to 40% of its products :-
Comments
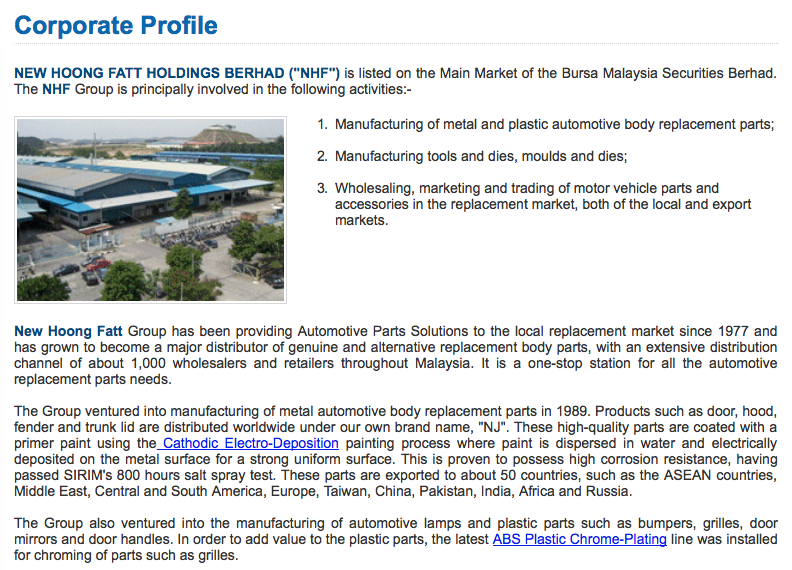
(a) Well managed replacement parts manufacturer with many years of proven track record.
(b) Strong balance sheets.
(c) 40% of products exported. The weak Ringgit should boost earnings in coming quarters.
(d) Lower oil price should benefit the group as it uses plastic resins as raw materials.
(e) First nine months of 2014 saw earnings dropped by closed to 50%. Does this spell troubles for longer term prospects ? At current price, PER is more than 17 times (unless earnings can catch up).
(f) High dividend yield of 4.8%. But sustainability depends on future profitability.
====================================================================================
Niche Capital Emas Holding
Niche Capital Emas Holding (NCHB) Snapshot
|
Open
0.14
|
Previous Close
0.14
|
|
|
Day High
0.14
|
Day Low
0.14
|
|
|
52 Week High
06/6/14 - 0.19
|
52 Week Low
12/15/14 - 0.10
|
|
|
Market Cap
31.5M
|
Average Volume 10 Days
188.7K
|
|
|
EPS TTM
-0.01
|
Shares Outstanding
233.1M
|
|
|
EX-Date
05/6/04
|
P/E TM
--
|
|
|
Dividend
--
|
Dividend Yield
--
|
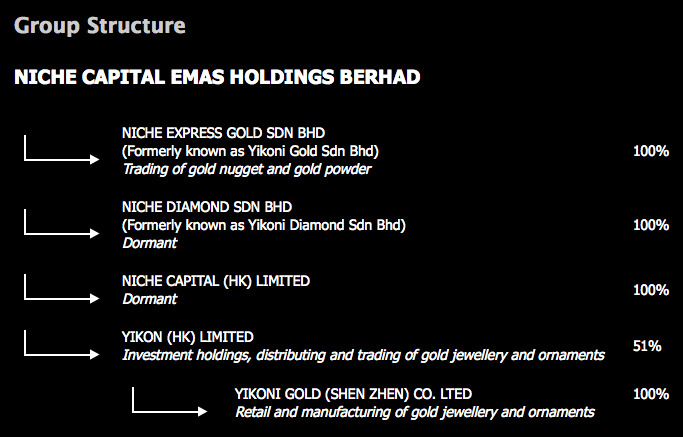
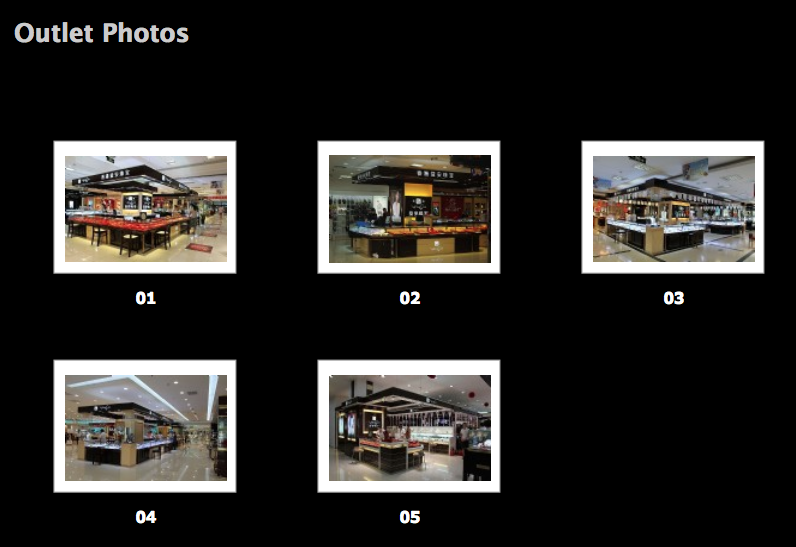
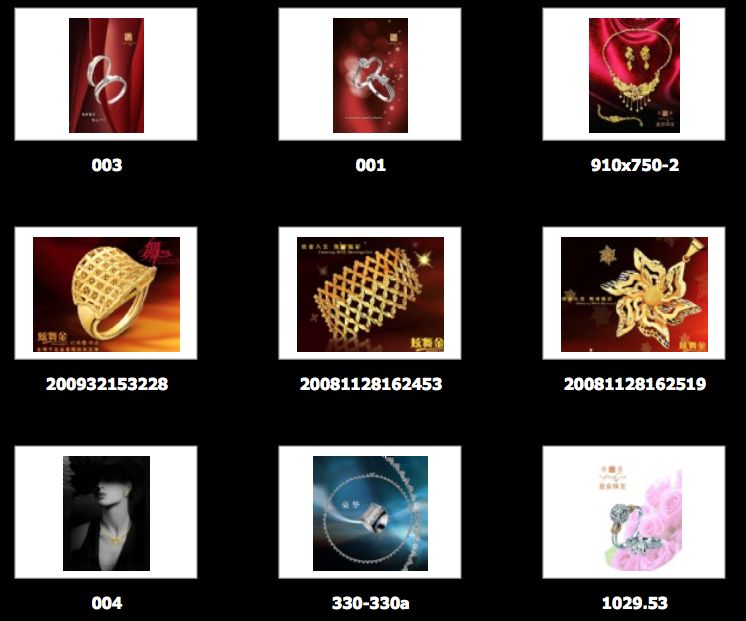
Niche Capital Emas Holdings Berhad, an investment holding company, manufactures and sells gold jewelry and ornaments.The company has operations in Malaysia, the People's Republic of China, and Hong Kong. Niche Capital Emas Holdings Berhad is based in Penang, Malaysia.

Quarter Result:
| F.Y. | Quarter | Revenue ('000) | Profit before Tax ('000) | Profit Attb. to SH ('000) | EPS (Cent) | DPS (Cent) | NAPS |
|---|---|---|---|---|---|---|---|
| 2014-12-31 | 2014-09-30 | 3,467 | -1,656 | -1,004 | -0.85 | - | 0.1000 |
| 2014-12-31 | 2014-06-30 | 4,427 | 5,891 | 6,129 | 5.19 | - | 0.1100 |
| 2014-12-31 | 2014-03-31 | 9,054 | -674 | -468 | -0.40 | - | 0.0600 |
| 2013-12-31 | 2013-12-31 | 5,190 | -6,940 | -6,283 | -5.32 | - | 0.0800 |
| 2013-12-31 | 2013-09-30 | 9,488 | -1,197 | -823 | -0.70 | - | 0.1300 |
| 2013-12-31 | 2013-06-30 | 12,344 | -1,066 | -774 | -0.66 | - | 0.1300 |
| 2013-12-31 | 2013-03-31 | 8,982 | -611 | -536 | -0.45 | - | 0.1300 |
| 2012-12-31 | 2012-12-31 | - | - | - | - | - | - |
| 2012-12-31 | 2012-09-30 | 3,929 | -1,497 | -1,272 | -1.45 | - | 0.1500 |
| 2012-12-31 | 2012-06-30 | 6,897 | -590 | -296 | -0.68 | - | 0.2600 |
| 2012-06-30 | 2012-03-31 | 7,248 | -280 | -237 | -0.55 | - | 0.2600 |
Comments
I didn't do a detailed study of this group as I am not really interested in the industry and business they are in.
============================================================================================
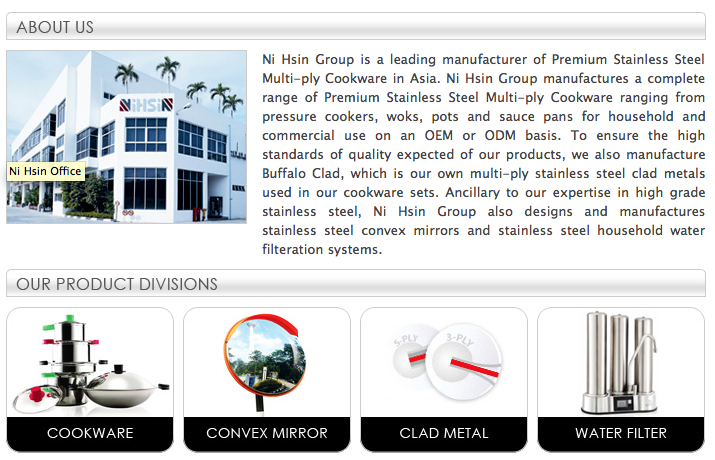
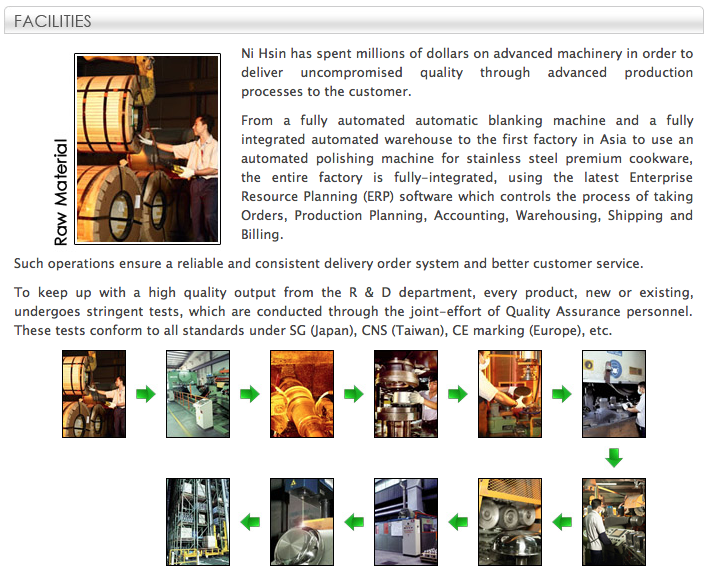
Ni Hsin Resources
Ni Hsin Resources Bhd (NHR) Snapshot
|
Open
0.36
|
Previous Close
0.44
|
|
|
Day High
0.39
|
Day Low
0.35
|
|
|
52 Week High
10/30/14 - 0.55
|
52 Week Low
03/25/14 - 0.17
|
|
|
Market Cap
85.5M
|
Average Volume 10 Days
11.4M
|
|
|
EPS TTM
0.0008
|
Shares Outstanding
231.0M
|
|
|
EX-Date
10/16/14
|
P/E TM
462.5x
|
|
|
Dividend
0.0050
|
Dividend Yield
1.35%
|
Quarter Result:
| F.Y. | Quarter | Revenue ('000) | Profit before Tax ('000) | Profit Attb. to SH ('000) | EPS (Cent) | DPS (Cent) | NAPS |
|---|---|---|---|---|---|---|---|
| 2014-12-31 | 2014-09-30 | 10,246 | 1 | -159 | -0.07 | - | 0.2600 |
| 2014-12-31 | 2014-06-30 | 9,529 | 317 | 224 | 0.07 | 0.01 | 0.2600 |
| 2014-12-31 | 2014-03-31 | 10,364 | -366 | -547 | -0.24 | - | 0.2600 |
| 2013-12-31 | 2013-12-31 | 14,422 | 1,375 | 749 | 0.32 | - | 0.2600 |
| 2013-12-31 | 2013-09-30 | 13,310 | 1,074 | 791 | 0.34 | - | 0.2600 |
| 2013-12-31 | 2013-06-30 | 12,780 | 849 | 612 | 0.26 | 0.01 | 0.2600 |
| 2013-12-31 | 2013-03-31 | 14,638 | 340 | 127 | 0.05 | - | 0.2600 |
| 2012-12-31 | 2012-12-31 | 15,779 | 731 | 877 | 0.38 | - | - |
| 2012-12-31 | 2012-09-30 | 12,034 | 282 | 10 | - | - | 0.2600 |
| 2012-12-31 | 2012-06-30 | 10,377 | -205 | -408 | -0.18 | - | 0.2600 |
| 2012-12-31 | 2012-03-31 | 11,745 | 680 | 426 | 0.18 | - | 0.2600 |
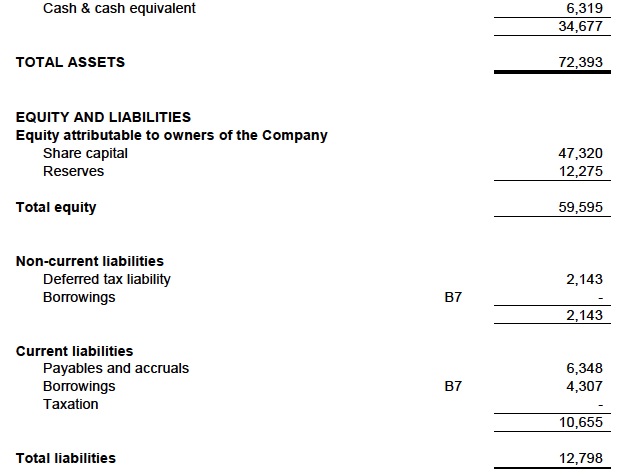
Healthy balance sheets :
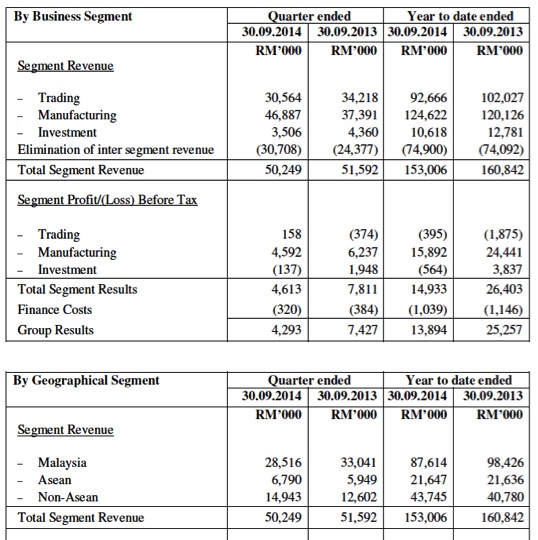
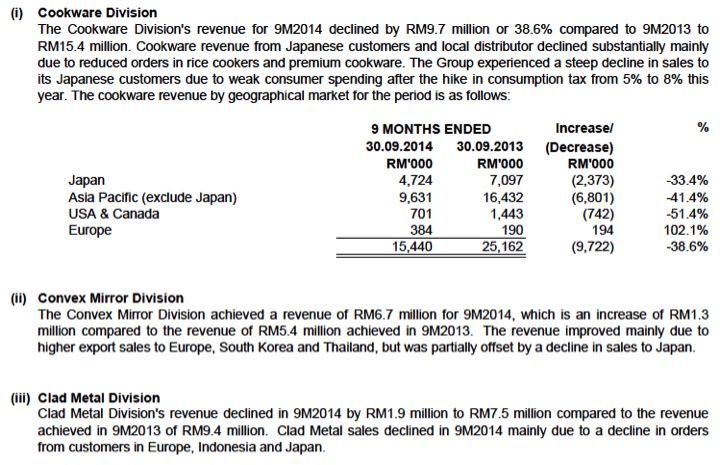
Segmental breakdown by revenue :

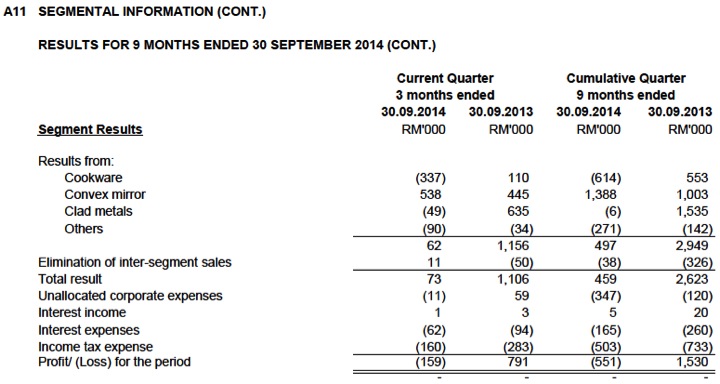
Segmental breakdown by profit :
Segmental btreakdown by geographical region. It seemed that the bulk of the group's products are exported.
Comments
(a) Small market cap of RM85 mil. Strong balance sheets.
(b) All this while, has been operating at breakeven level. However, as most of its products are exported, earnings should improve in coming quarters as Ringgit has weakended substantially. Nevertheless, this has more or less been priced in as share price has rallied from 25 sen to 45 sen over past few months.
(c) Despite better prospects, I am cautious about investing in this group. If a group has to rely purely on weak currency to boost its competitivenss, what will happen if the Ringgit return to normal ?
============================================================================
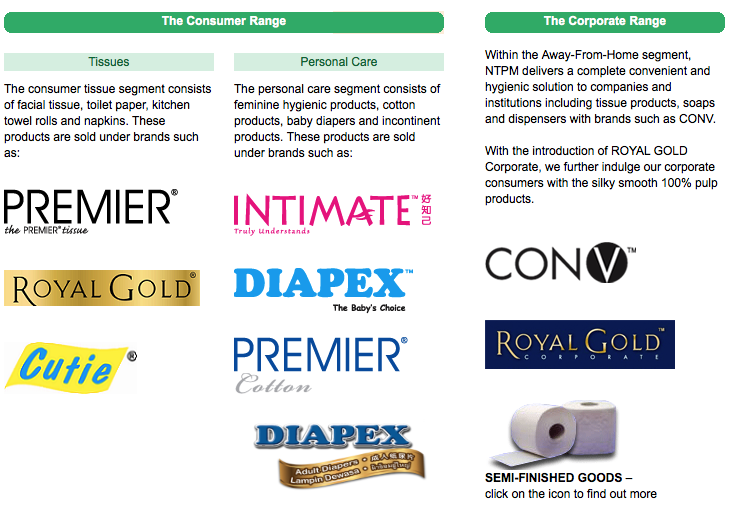
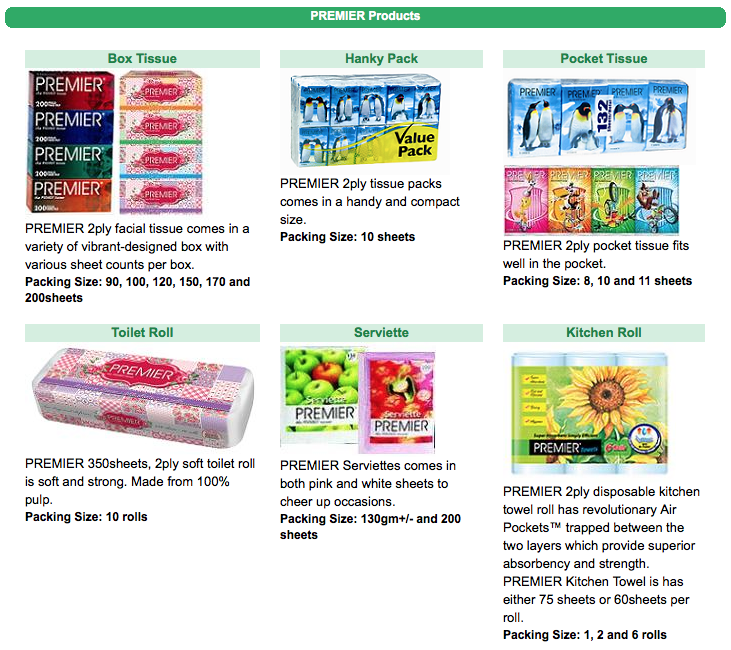
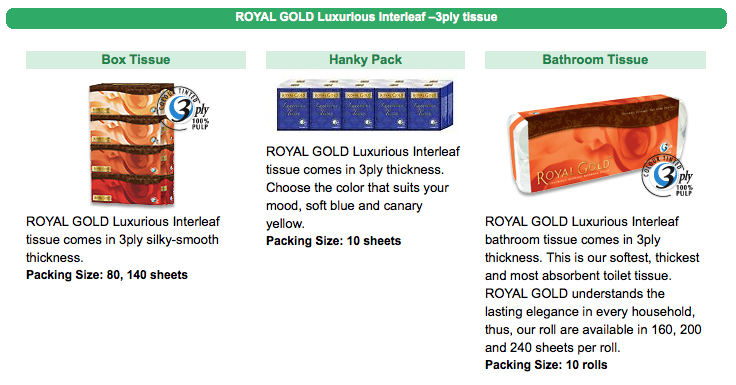
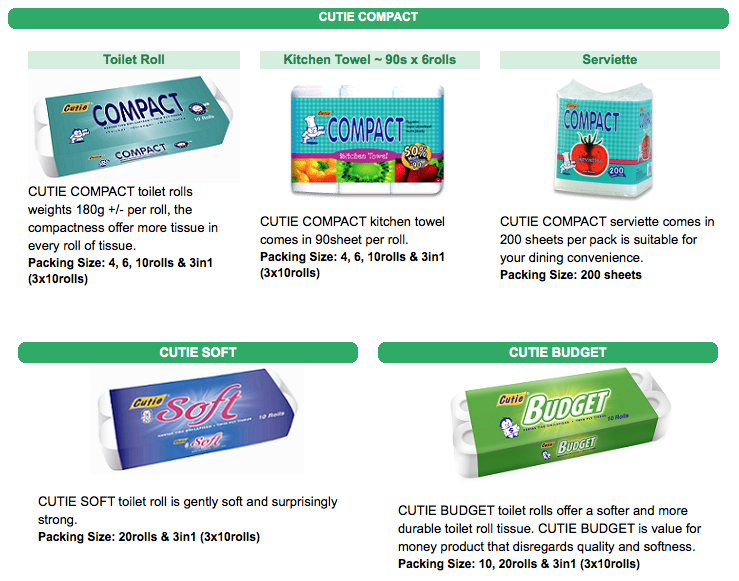
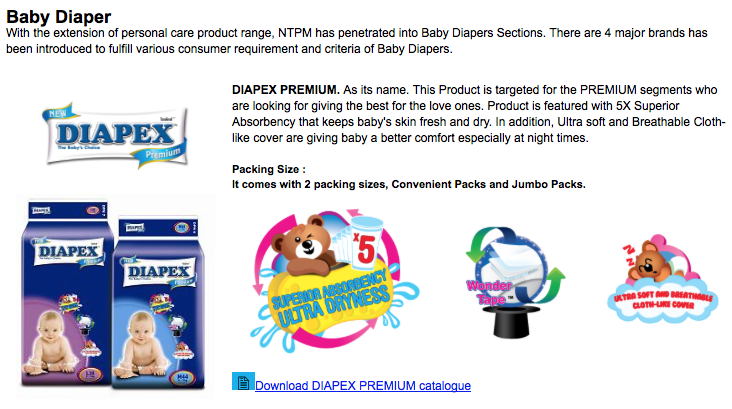
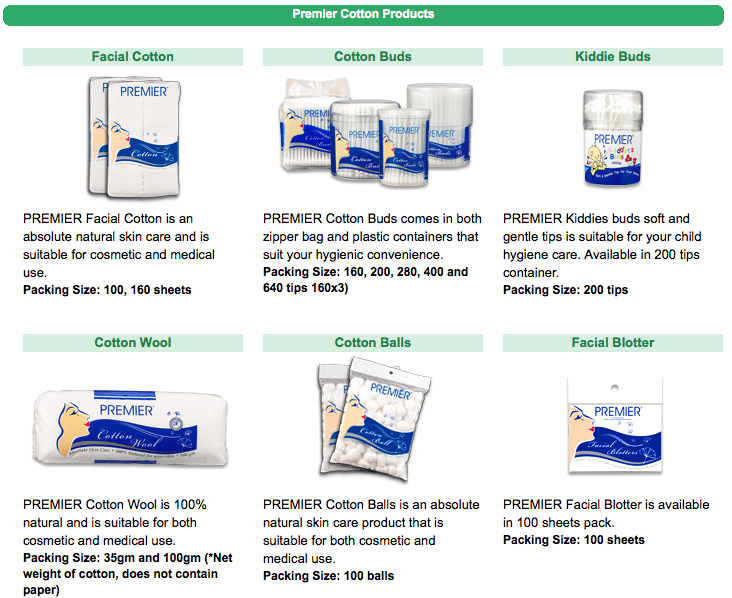
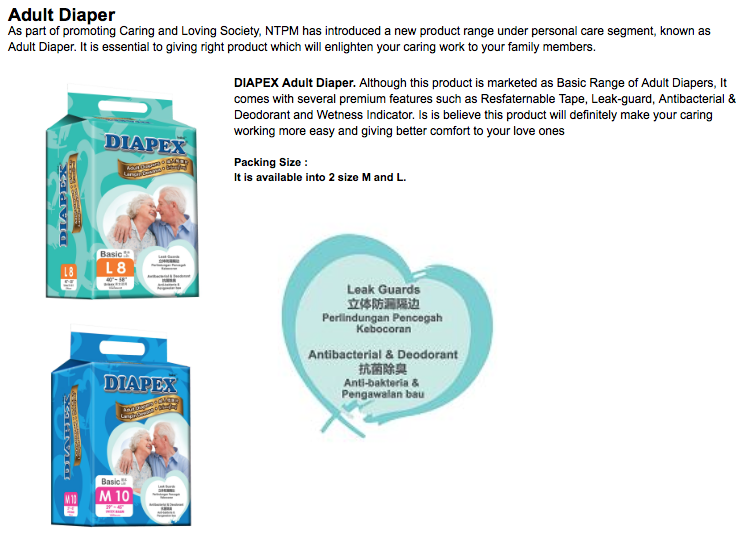
NTPM
Ntpm Holdings Bhd (NTPM) Snapshot
|
Open
0.65
|
Previous Close
0.65
|
|
|
Day High
0.65
|
Day Low
0.64
|
|
|
52 Week High
06/4/14 - 0.90
|
52 Week Low
12/24/14 - 0.60
|
|
|
Market Cap
724.4M
|
Average Volume 10 Days
504.5K
|
|
|
EPS TTM
0.04
|
Shares Outstanding
1.1B
|
|
|
EX-Date
09/9/14
|
P/E TM
17.4x
|
|
|
Dividend
0.03
|
Dividend Yield
4.50%
|


Quarter Result:
| F.Y. | Quarter | Revenue ('000) | Profit before Tax ('000) | Profit Attb. to SH ('000) | EPS (Cent) | DPS (Cent) | NAPS |
|---|---|---|---|---|---|---|---|
| 2015-04-30 | 2014-10-31 | 138,091 | 12,557 | 9,198 | 0.80 | - | 0.3000 |
| 2015-04-30 | 2014-07-31 | 132,244 | 9,845 | 7,002 | 0.60 | - | 0.3100 |
| 2014-04-30 | 2014-04-30 | 135,964 | 13,814 | 11,703 | 1.00 | 1.45 | 0.3000 |
| 2014-04-30 | 2014-01-31 | 132,854 | 18,847 | 14,193 | 1.30 | 1.45 | 0.3100 |
| 2014-04-30 | 2013-10-31 | 126,872 | 20,636 | 16,021 | 1.40 | - | 0.3000 |
| 2014-04-30 | 2013-07-31 | 124,757 | 16,583 | 11,975 | 1.10 | - | 0.2900 |
| 2013-04-30 | 2013-04-30 | 126,352 | 17,077 | 12,827 | 1.20 | 1.45 | - |
| 2013-04-30 | 2013-01-31 | 127,521 | 18,819 | 13,827 | 1.20 | 1.45 | 0.2800 |
| 2013-04-30 | 2012-10-31 | 118,524 | 16,953 | 12,265 | 1.10 | - | 0.2700 |
| 2013-04-30 | 2012-07-31 | 114,861 | 14,515 | 10,213 | 0.90 | - | 0.2600 |
| 2012-04-30 | 2012-04-30 | 115,625 | 16,166 | 11,814 | 1.10 | 1.45 | - |
| 2012-04-30 | 2012-01-31 | 116,304 | 18,063 | 14,384 | 1.30 | 1.45 | 0.2400 |
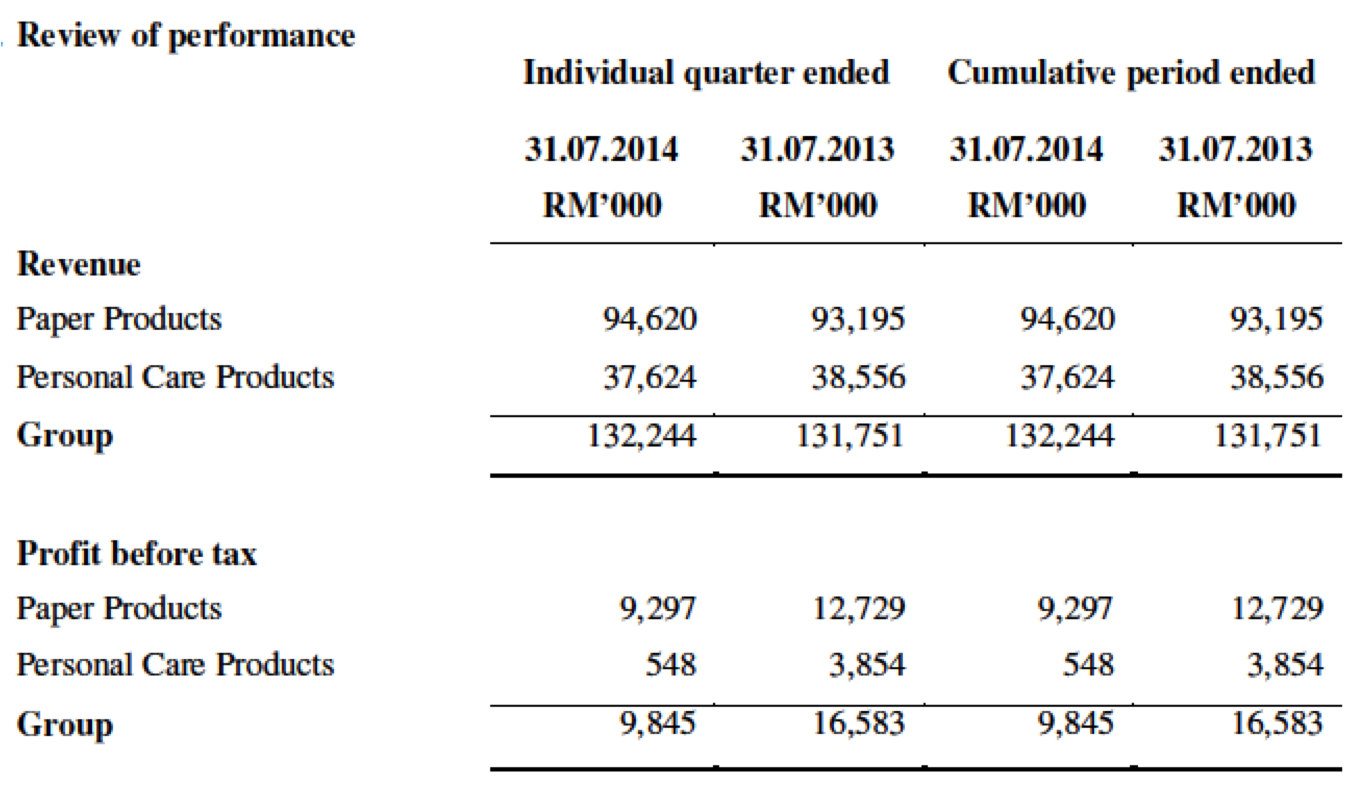
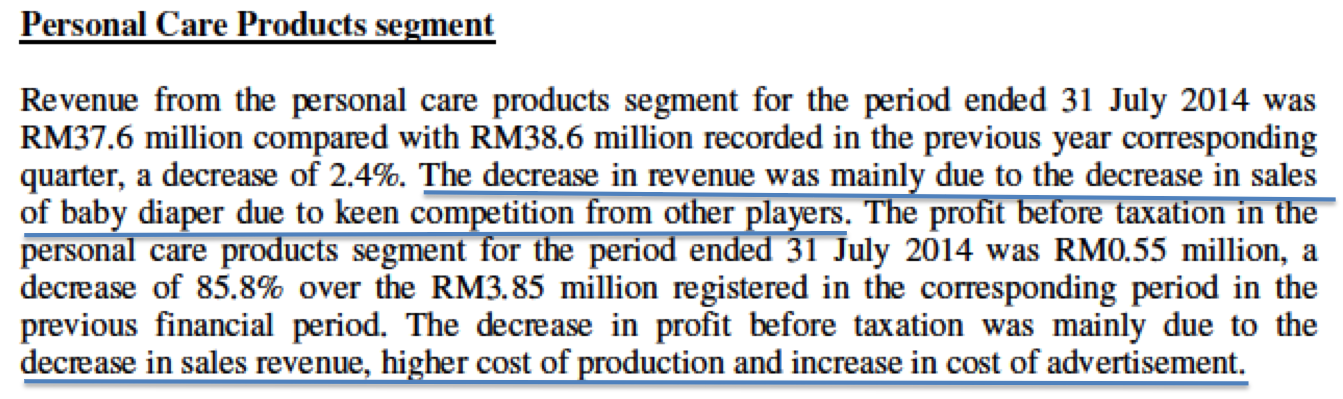
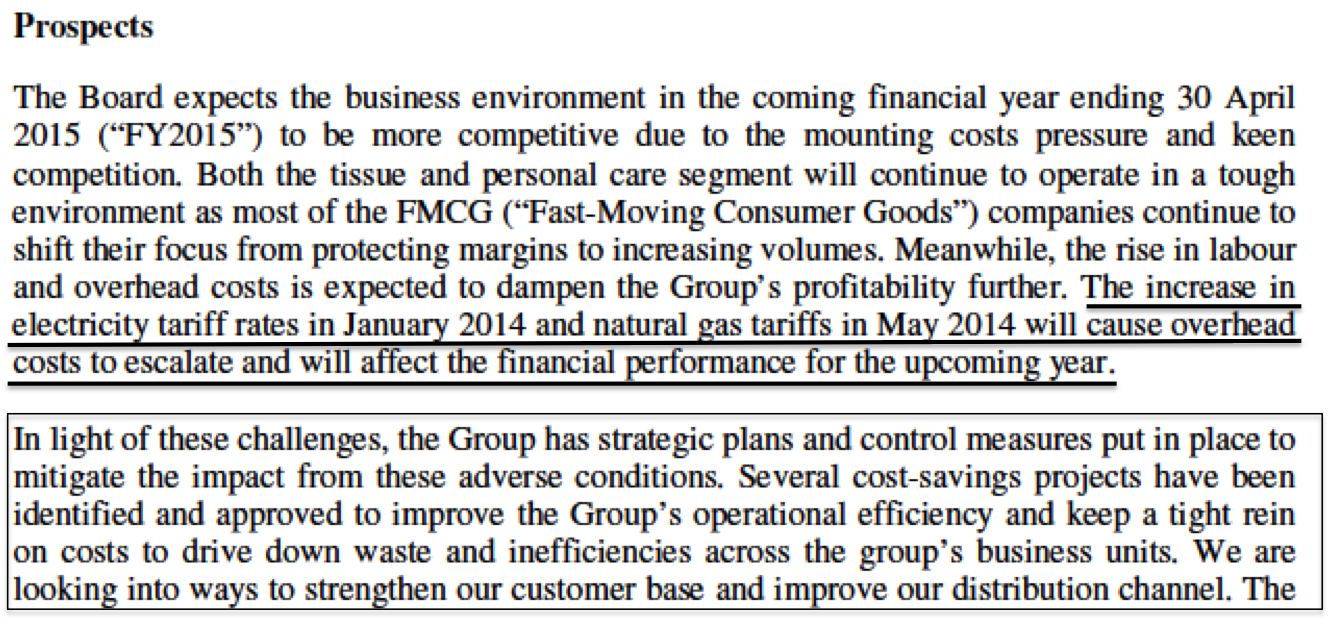
NTPM reported lower earnings in July and October 2014 quarters. As a result, share price declined from 80 sen range to 60 sen range. Managment explained that the decline was due to higher utility and labour cost as well as competition.
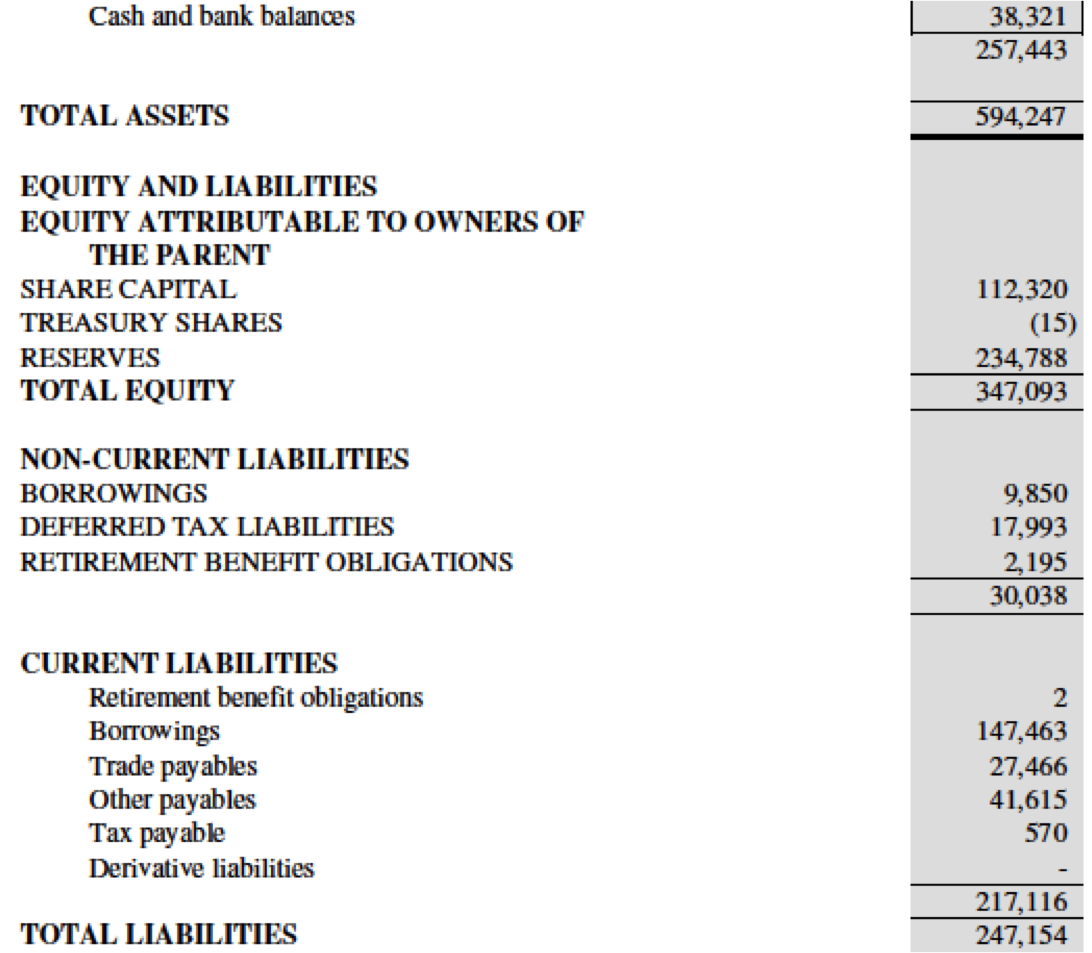
Surprisingly, the group has quite a fair bit of borrowings, with net gearing at 0.32 times.
Comments
The company has put in place cost cutting measures to restore profitability. We will have to wait for next few quarters to see whether performance will improve.
Related Stocks
| Chart | Stock Name | Last | Change | Volume |
|---|
More articles on Icon8888 Gossips About Stocks
(Icon) Jaks Resources - IRR Model Shows That RM300 mil Net Profit p.a. For 30% Stake Is Plausible
Created by Icon8888 | May 01, 2020
(Icon) Notion VTec - Forget About The Virus, It Is Time To Rock and Roll
Created by Icon8888 | Mar 10, 2020
(Icon) Sam Engineering - Excellent Result. Share Price Can Potentially Double Within 2 Years
Created by Icon8888 | Mar 01, 2020
(Icon) Alliance Bank - One Off Provision Affected Previous Quarter Earning. Time To Buy On Weakness
Created by Icon8888 | Nov 13, 2019
Discussions
2 people like this. Showing 14 of 14 comments
thanks Icon888 bro.... really like your write up. WOA>.. now I know PohKong and DEGEM are same line with NICHE Capital EMAS....
For Diamond series I like DEGEM the most..... they can give us the best service. For w.band I think Tiffany & Co still the great range of choices.....
ohhh no..... I cant talk Diamond... can talk 1 - 2 days non stop....... jz so excited
2015-02-07 23:43
thanks...good write up. any startegy for Johore tin? accumulate johore tin warrant?
2015-02-08 09:46
688888 if you don't want to become 4444444 better stick to fundamentals, instead of following rumours...
2015-02-08 15:43
GONG XI FA CAI Icon8888
after I read so many of ur write up.
I know 10 facts about you:
Fact 1: You are reading this.
Fact 2: You can't say the letter 'm' without touching your lips.
Fact 3: You just tried it.
Fact 4: You're smiling.
Fact 6: You're smiling or laughing again.
Fact 7: You didn't notice I missed fact 5.
Fact 8: You just checked it.
Fact 9: You're smiling again.
Fact 10: You like this and you're going to rate or comment. :)
2015-02-08 17:08
busy lo....
tolong auntie uncle sini angkat sana angkut lo....
when u start cuti??? or day long cuti jor? are u still active in medium and long term investment. We close everything since 2 weeks back. Now focus on short term............
2015-02-08 17:15
Post a Comment
Featured Posts
Introducing MY's First IPO Fund for Sophisticated Investors!
New Update. Discover investment communities that resonate with your ideas
M & A Value Partners IPO Equity Fund has been launched - Targeted 13% Return p.a
Latest Videos


Apps


Top Articles
1
2
BFM Podcast
3
MQ Market Updates
4
TA Sector Research
5
BFM Podcast
6
BFM Podcast
7
PublicInvest Research
8
#
Stock
Score
Daily Stocks
Stock Name
Last
Change
Volume
Stock Name
Last
Change
Volume
Stock Name
Last
Change
Volume
Featured Advertisers / Partners


Ride The Bull Short The Bear
CS Tan
4.9 / 5.0
This book is the result of the author's many years of experience and observation throughout his 26 years in the stockbroking industry. It was written for general public to learn to invest based on facts and not on fantasies or hearsay....
willnck
Thanks,Icon.Doing a wonderful job here.Made me more aware as to what these companies are actually producing.
2015-02-07 23:09