(Icon) Harrisons Holdings - Slow and Steady
Icon8888
Publish date: Sat, 28 Feb 2015, 01:30 PM
Harrisons Holdings Malaysia (HHM) Snapshot
|
Open
3.16
|
Previous Close
3.20
|
|
|
Day High
3.30
|
Day Low
3.16
|
|
|
52 Week High
10/24/14 - 4.05
|
52 Week Low
03/4/14 - 2.98
|
|
|
Market Cap
226.0M
|
Average Volume 10 Days
6.8K
|
|
|
EPS TTM
-0.12
|
Shares Outstanding
68.5M
|
|
|
EX-Date
07/17/14
|
P/E TM
--
|
|
|
Dividend
0.15
|
Dividend Yield
4.55%
|
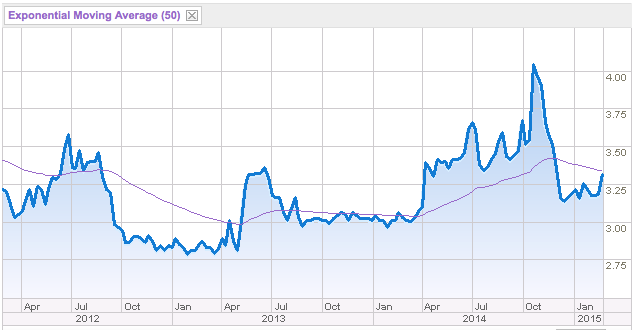
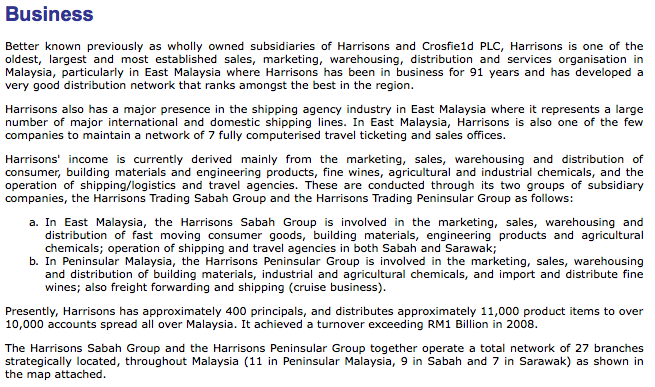
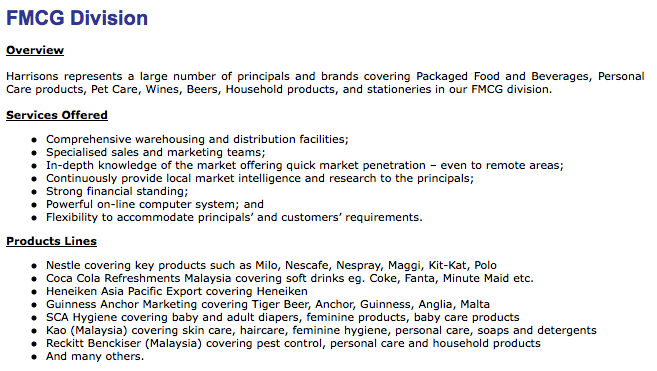
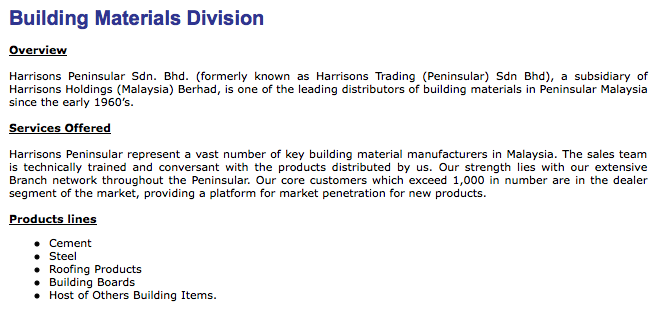
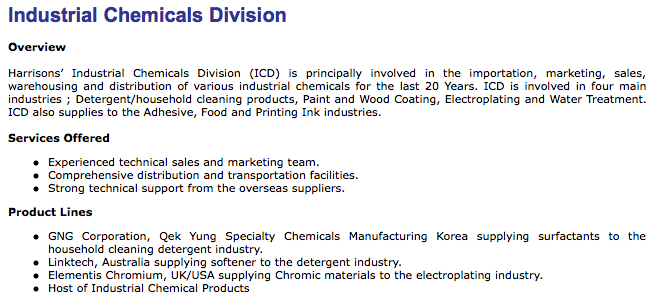
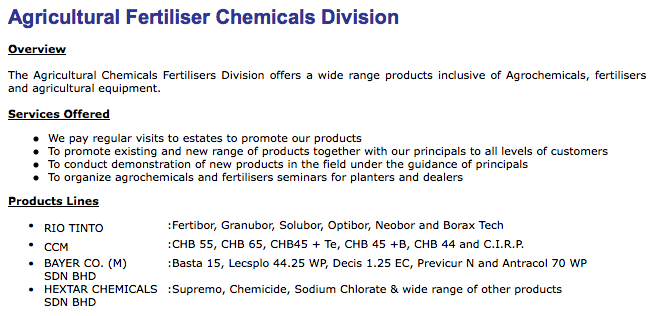
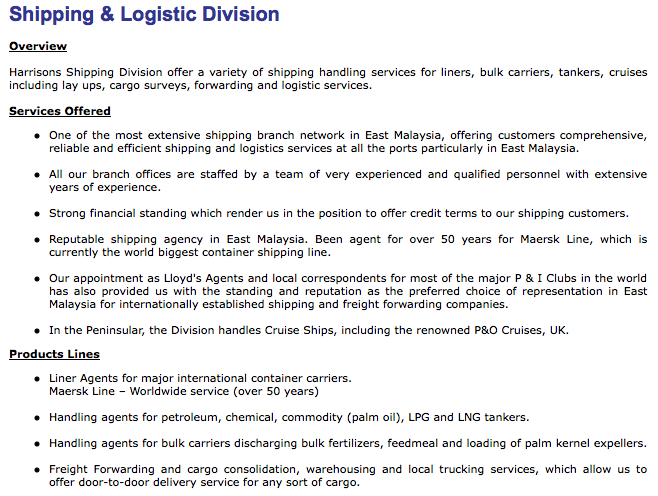
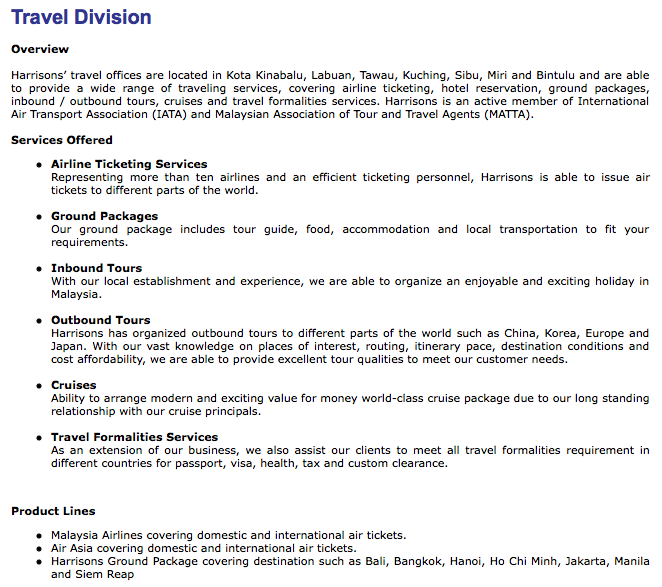
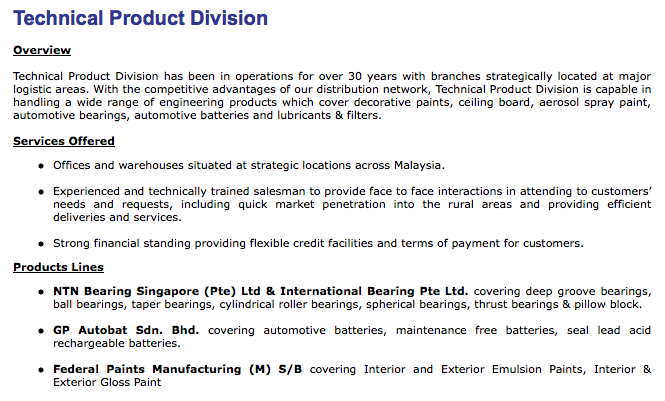
Harrisons Holdings (Malaysia) Berhad distributes consumer goods, engineering products, building materials, wines, and chemical products primarily in Malaysia. Please refer to Appendix below for further details of the group.
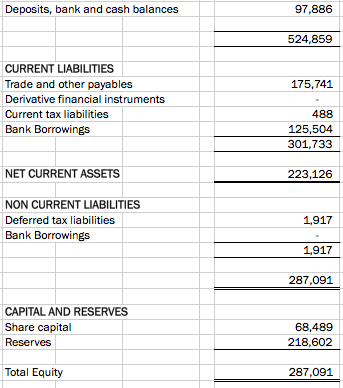
The group has healthy balance sheets. With net assets of RM287 mil, loans of RM126 mil and cash of RM98 mil, net gearing is approximately 0.1 time only.
During the March 2014 quarter, the group incurred RM31.5 mil to settle unpaid duty or taxes to Customs, resulting in net loss of RM25.2 mil. Apart from that, the other quarters are pretty consistent with net profit of RM5 to 7 mil.
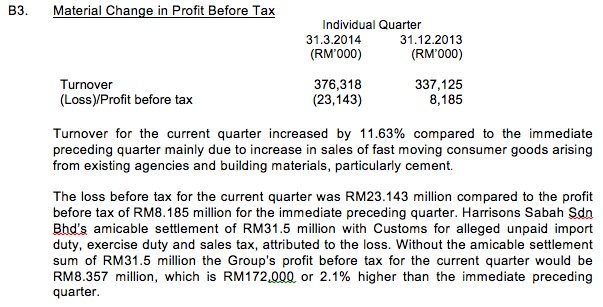
Excluding the RM31.5 mil exceptional item, March 2014 quarter's net profit would be RM6.3 mil. Cumulative 12 months net profit would be RM22.9 mil. Based on 68.5 mil shares, EPS is 33.4 sen. At RM3.30, PER is approximatyely 10 times.
Quarter Result:
| F.Y. | Quarter | Revenue ('000) | Profit before Tax ('000) | Profit Attb. to SH ('000) | EPS (Cent) | NAPS |
|---|---|---|---|---|---|---|
| 2014-12-31 | 2014-12-31 | 339,729 | 6,162 | 5,179 | 7.56 | 4.1900 |
| 2014-12-31 | 2014-09-30 | 349,164 | 6,372 | 4,474 | 6.53 | 4.1200 |
| 2014-12-31 | 2014-06-30 | 381,271 | 9,654 | 6,951 | 10.15 | 4.1900 |
| 2014-12-31 | 2014-03-31 | 376,318 | -23,143 | -25,183 | -36.78 | 4.1000 |
| 2013-12-31 | 2013-12-31 | 337,125 | 8,185 | 7,047 | 10.29 | - |
| 2013-12-31 | 2013-09-30 | 355,293 | 8,503 | 6,155 | 8.99 | 4.3500 |
| 2013-12-31 | 2013-06-30 | 356,490 | 9,444 | 6,709 | 9.80 | 4.4100 |
| 2013-12-31 | 2013-03-31 | 351,143 | 9,036 | 6,362 | 9.29 | 4.3000 |
| 2012-12-31 | 2012-12-31 | 327,861 | 9,395 | 7,102 | 10.37 | - |
| 2012-12-31 | 2012-09-30 | 343,182 | 8,389 | 5,583 | 8.15 | 4.0900 |
| 2012-12-31 | 2012-06-30 | 348,827 | 11,028 | 7,819 | 11.42 | 4.2100 |
| 2012-12-31 | 2012-03-31 | 346,020 | 11,193 | 7,858 | 11.48 | 4.1000 |
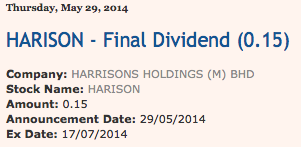
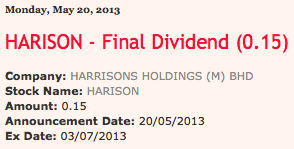
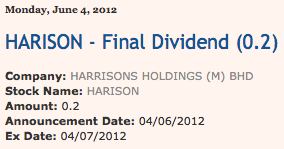
Over the past three years, Harrison paid out dividend of 15 sen to 20 sen per annum. This translates into yield of 4.5% to 6.1%.
=======================================
Appendix - Harrisons Group



Related Stocks
| Chart | Stock Name | Last | Change | Volume |
|---|
Market Buzz
More articles on Icon8888 Gossips About Stocks
Created by Icon8888 | May 01, 2020
Created by Icon8888 | Mar 10, 2020
Created by Icon8888 | Mar 01, 2020
Created by Icon8888 | Nov 13, 2019


