


Icon8888 Gossips About Stocks
(Icon) MACD (1) - An Introduction To Moving Average Convergence Divergence

1. Introduction
MACD (pronounced as MAC D) is a popular tool many traders use. The calculation behind the MACD is fairly simple. Essentially, it calculates the difference between 12-day and 26-day Exponential Moving Averages (EMA).
MACD = 12 Day EMA - 26 Day EMA
The calculation of both EMAs uses the closing prices of whatever period is measured.
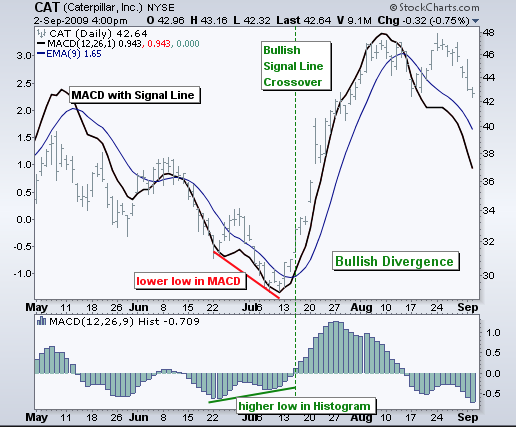
On the MACD chart, a nine-day EMA of MACD itself (Signal Line) is plotted as well.
2. Buying and Selling Based On MACD
Three ways to read MACD :
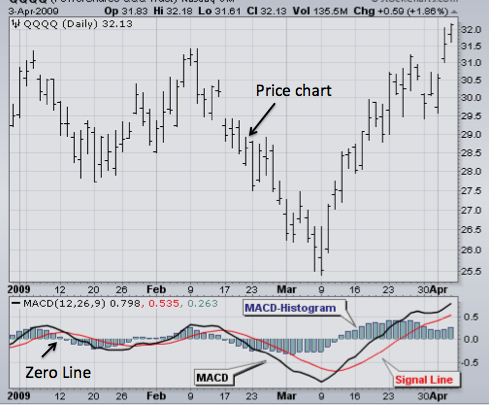
(i) Cross Over of Zero Line - When MACD is positive (above Zero Line), the stock's price is in bullish territory. The opposite is true when MACD is negative. As such, a cross over from positive to negative signals a trend reversal.
In other words, MACD crosses above and below Zero Line is a Buy and Sell signal respectively.
(ii) Cross Over of Signal Line - MACD crosses above and below Signal Line is also a Buy and Sell signal respectively.
This can also be done through reading the Histogram. Histogram is the difference between MACD and Signal Line. When MACD crosses Signal Line, the value of histogram will be zero.
When come to Histogram, it is good if the value is huge. A huge distance between MACD and Signal Line means that momentum is continuing in the desirable direction. Based on the same principle, a shrinking Histogram is something to be monitored closely - always remember that a zero histogram is equivalent to MACD crossing over of Signal Line, a trend reversal.
What is the relationship between Zero Line crossover and Signal Line crossover ? You can rely on either one to detect Buy and Sell signals. However, Signal Line crossover is more sensitive than Zero Line. It gives earlier signal. Usually only after Signal Line crossover, Zero Line crossover will happen.

As shown in chart above, MACD (Blue Line) always crosses Signal Line (Red Line) before it finally crosses Zero Line (Black Line). As such, if you rely on Signal Line cross over, you will always Buy / Sell earlier than the person who relies on Zero Line cross over.
The weakness of method (i) and (ii) above is that when market moves sideway, you will have problem of Whipsawing (frequent signals of Buy and Sell). Method (iii) below faces less such problem.
(iii) Divergence - Divergence happens when price chart is trending down while MACD trending up (Buy signal).

On the other hand, price chart trending high while MACD trending low is a Sell signal.
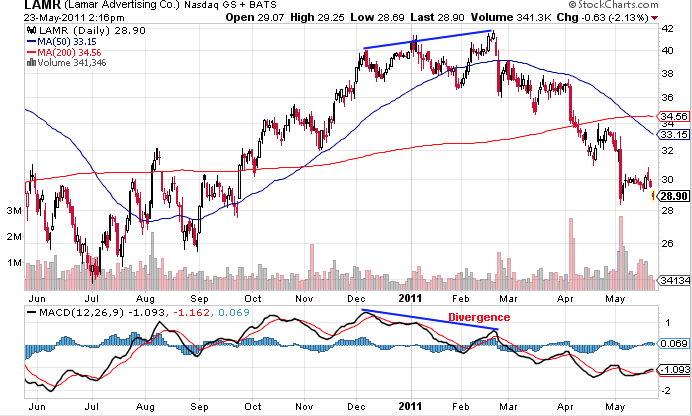
Alternatively, you can use MACD Histogram vs. price instead of MACD vs. price to detect Divergence.
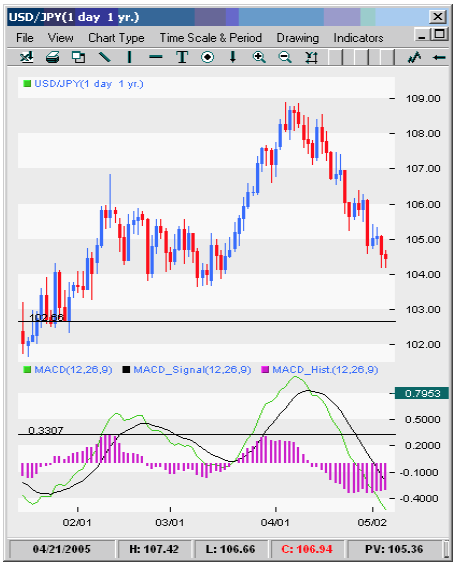
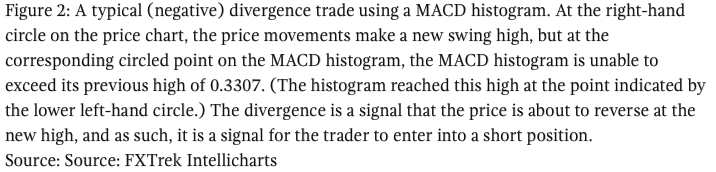
Alternatively, instead of comparing price chart with MACD, Divergence can be detected by comparing Histogram with MACD.
(3) Last But Not Least
Just like any other technical tools, MACD will serve you well when there is a clear trend. When price sideways, you will be whipsawed to death.
More articles on Icon8888 Gossips About Stocks
(Icon) Jaks Resources - IRR Model Shows That RM300 mil Net Profit p.a. For 30% Stake Is Plausible
Created by Icon8888 | May 01, 2020
(Icon) Notion VTec - Forget About The Virus, It Is Time To Rock and Roll
Created by Icon8888 | Mar 10, 2020
(Icon) Sam Engineering - Excellent Result. Share Price Can Potentially Double Within 2 Years
Created by Icon8888 | Mar 01, 2020
(Icon) Alliance Bank - One Off Provision Affected Previous Quarter Earning. Time To Buy On Weakness
Created by Icon8888 | Nov 13, 2019
Discussions
6 people like this. Showing 37 of 37 comments
I usually don't jump into conclusion like that. To master a new skill, absorb everything first, chew on it, digest it, then make conclusion
you always have the sequence wrong. That is my observation of you
2016-05-05 23:52
What about golden cross and death cross pattern.can we refer that as indicator too.
2016-05-05 23:59
that is a different topic. I will write about it after I study and digest the basics. There are many many other indicators.
My guess is that ultimately, the ability to apply multiple indicators to cross check with each other will significantly enhance effectiveness and make TA workable
I am working towards that goal
2016-05-06 00:03
Never found any use for Macd.
Or Bolinger band
Stochastic and Rsi a bit of use...not much.
There is no replacement for the intellect., the guts, the psychology , the sentiments, the trend,
2016-05-06 00:06
I reserve my judgement until I fully master TA
I have seen how OTB makes use of TA to spot Breakout
It works
2016-05-06 00:10
Based on preliminary understanding of the subject, my intended use of TA will focus on detecting Breakout. It is unlikely that I will be actively trading based on Trend line. My observation so far is that those things are too subjective
2016-05-06 00:12
Certain chart patterns are very useful
That is because chart pattern reflect the collective behavior of participants.
Chart patterns tend to repeat
After a while of buying, exhaustions emerge, head and shoulders emerge.
Resistance and support lines emerge.
Psychological factors gets printed into chart patterns.
2016-05-06 00:16
ya, these are stuffs that I will try to learn as well
nothing is off the radar until I fully digest it
2016-05-06 00:18
another way to say it is that chart pattern tells you the story of how people buy and sell a particular asset in the past. Based on those legacy, TA tries to predict how those people will act in the future
Posted by stockmanmy > May 6, 2016 12:16 AM | Report Abuse
Certain chart patterns are very useful
That is because chart pattern reflect the collective behavior of participants.
Chart patterns tend to repeat
2016-05-06 00:20
How I managed to sell my Aax in the day that it peaked at 39.5, bought at 25 sens.
How I managed to delay selling until the very peak?
Definitely not Macd, not Rsi, not stochastic or any of the fancy stuffs.
2016-05-06 00:33
U need to show proof. Otherwise people will say u BS
stockmanmy How I managed to sell my Aax in the day that it peaked at 39.5, bought at 25 sens.
How I managed to delay selling until the very peak?
Definitely not Macd, not Rsi, not stochastic or any of the fancy stuffs.
2016-05-06 07:20
A fisherman knows that the sea is dangerous and the storm horrible, but these perils are not sufficient reasons for him to remain ashore.
An about-drowned boy would grip on anything that would keep him afloat even if what he embraces is only a rotten tree branch.
Needless to say, trading and investing in equity market is very risky.
To me TA is more than just a life buoy, a life-saving tool. It is good to learn some TA skills while looking for a lighthouse if you are at sea (In this context, if one still like to be involve in equity market).
Icon8888, a teacher would make further self-improvement (even though he may never realize it) in the process of teaching and sharing of his knowledge.
A right step towards greater self-improvement.
Just keep it up, Icon8888.
Cheers.
2016-05-06 07:32
After the Global Financial Crisis of 2008-2009, Wall Street had this to say: Those who embrace TA skill for signals would be less hurt financially than those who just buy and keep the shares.
Although these were not the actual words of Wall Street Journal, but those were what I read from NST.
2016-05-06 07:43
ckwan I am no teacher of TA, just a student
I wrote about MACD for record purpose. The article sums up all I learn so that I can come back and read it in the future
I agree with you it is not rationale to write off TA as fancy stuffs. When a bottle is full, u can't pour water into it
2016-05-06 07:52
I like candid discussions in i3investor Forum.
I always try to be unbiased and impartial.
2016-05-06 08:03
ckwan11d, recent survey I read said, rich were less hurt during financial crisis bcos they dare to cut lost, while the poor little fish kept holding hope the market would bounce back. nothing to do with TA, just mentality. partially bcos for the rich, lost few millions nothing much for them, they know they always can earn back the money, while the poor little fish, once get burnt, hard to come back.
2016-05-06 08:42
Well, it could be both of you are right
Many things in life need not be mutually exclusive
2016-05-06 08:49
This is purely for discussions only.
I am one of the very small fish in Bursa. My own very basic rules of investing:
1) Buy low and sell high. - that only leave me to think about how low is low ...
There is another saying quite similar to this : You only have to take care of the bottom and let Mr Market take care of the top.
2) Button my profit soonest possible and cut loss when I could sense the first sign of danger. - I normally buy at very low transacted volume and would sell when there is a sudden surge in volume. I preferred MACD over RSI for this.
I never trade IFCAMSC Bhd. But if I had, I think I could avoid the heavy trading losses if I stick to my rule.
One of my best performance was Johore Tin Bhd - reaping handsome profit during the period March 2012 - Dec 2012 (ranging from 94 Sen to about RM1.95) when I sensed that she was following the foot-step of Canone Bhd venturing into dairy business. I totally ignored about her when OSK (now RHB IB) excluded her in the top small cap pick in subsequently year. No look back.
I always keep all my contract notes.
2016-05-06 09:16
My bad luck for not following my own rules - making losses the very next day (both limit down) when I bought Solutions Bhd and Vis Dynamic Bhd (both Ace Market counters then).
Self discipline is vital. It wouldn't guarantee success but at least it may help to avoid heavy losses.
2016-05-06 09:25
X
knowing insufficient of TA skill can be as deadly as not knowing any. you either be an expert, or better don't waste time in it. it will take you easily 10yrs of experience to master it.
TA is not limited to just look at MACD RSI and all other fancy indicators. many indicators are rubbish. created just to sell you the software and license.
the Ultimate of TA reading is Chart pattern reading. it is as close to a Master Palm reader expect who can accurately tell you what your future is when you were only 5 yrs old.
TA indicators are like your daily/weekly horoscope. it changes with days and react to external factors.
2016-05-06 23:02
Macd tricks you into not using your brain.
Should focus on using the brain
2016-05-06 23:04
wah...this optimus very power now.... must of the latest version nanobots!
2016-05-06 23:05
notice the date
Posted by stockmanmy > Apr 21, 2016 03:17 PM | Report Abuse X
sold AAX
I am a trader at heart. Cost 25 sen
oil counters up, export counters up.
better take profit now.
2016-05-07 00:31
I also sold the day stockmanmy sold. at the highest.
my cost? maybe 15c. if you want to believe me, or believe him.
2016-05-07 02:04
Try using MACD for futures trading n you will lose yr pants. MACD is derived from moving averages. Moving averages are lagging indicators. I do not see ho MACD will give u any advantage in share trading.
2016-05-07 14:14
If u use Elliot Waves, why do u need MACD? Elliot Waves by themselves work very well.
2016-05-08 23:26
Post a Comment
Featured Posts


Apps


Top Articles
1
Follow Kim's Stockwatch!
THIS STOCK READY TO SKYROCKET!!! - THE POWER & WATER SUPPLY SERVICES
2
save malaysia!
3
Koon Yew Yin's Blog
Eversendai Corporation made a remarkable comeback in FY2023 - Koon Yew Yin
4
6
THE INVESTMENT APPROACH OF CALVIN TAN
7
Mercury Securities Research
8
AmInvest Research Reports
#
Stock
Score
Daily Stocks
Stock Name
Last
Change
Volume
Stock Name
Last
Change
Volume
Stock Name
Last
Change
Volume
MQ Trading Signals
Stock
Time
Signal
Duration
Stock
Time
Signal
Duration
Featured Advertisers / Partners


Ride The Bull Short The Bear
CS Tan
4.9 / 5.0
This book is the result of the author's many years of experience and observation throughout his 26 years in the stockbroking industry. It was written for general public to learn to invest based on facts and not on fantasies or hearsay....
stockmanmy
Have never found any use for it.
A simple price volume chart and guts is the best.
No unnecessary noise......just the pure actions.
2016-05-05 23:48