


8 minutes ago
![]() klee Rchi is rightly known as CW KING.
klee Rchi is rightly known as CW KING.
Much to learn from you.
13 minutes ago
![]() Apple888 Govt and TNB is in line.
Apple888 Govt and TNB is in line.
Increase tariff, but target the high income citizen a...
17 minutes ago
![]() Vincenzo999DeadMama @ Felix888999 if you are a MAN like Sifu OTB like to believe you are but not l...
Vincenzo999DeadMama @ Felix888999 if you are a MAN like Sifu OTB like to believe you are but not l...
17 minutes ago
![]() Vincenzo999DeadMama @ Felix888999 if you are a MAN like Sifu OTB like to believe you are but not l...
Vincenzo999DeadMama @ Felix888999 if you are a MAN like Sifu OTB like to believe you are but not l...
18 minutes ago
![]() Vincenzo999DeadMama @ Felix888999 if you are a MAN like Sifu OTB like to believe you are but not l...
Vincenzo999DeadMama @ Felix888999 if you are a MAN like Sifu OTB like to believe you are but not l...
18 minutes ago
![]() Vincenzo999DeadMama @ Felix888999 if you are a MAN like Sifu OTB like to believe you are but not l...
Vincenzo999DeadMama @ Felix888999 if you are a MAN like Sifu OTB like to believe you are but not l...
22 minutes ago
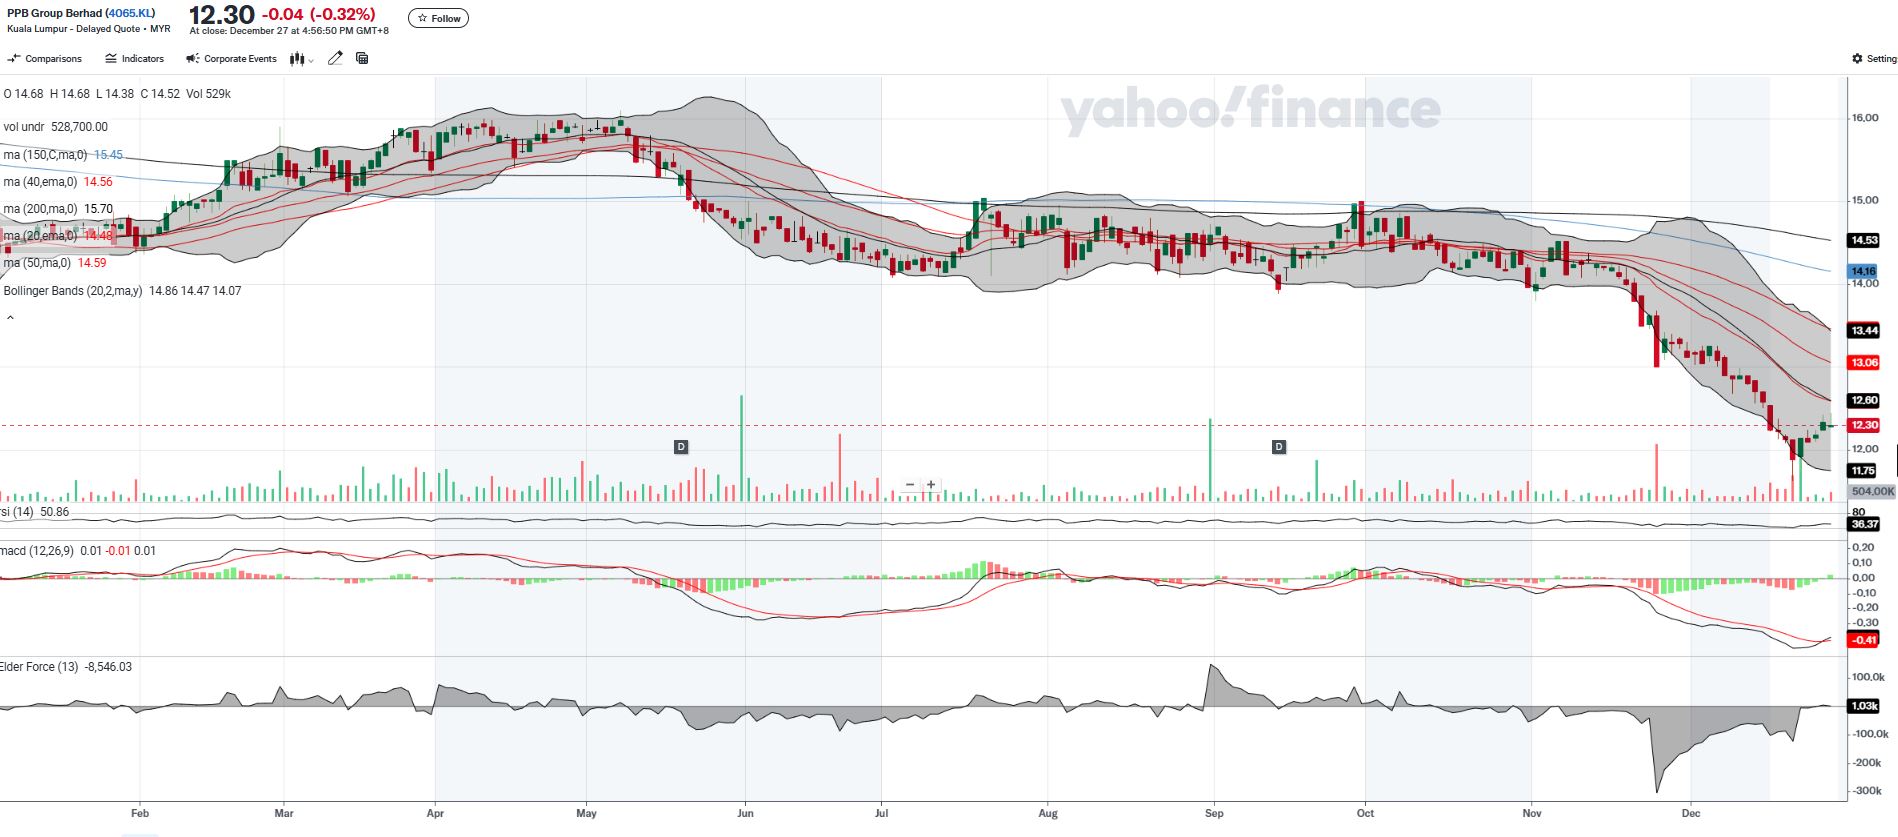
![]() KingKKK Technical Outlook - PPB (From Bottom to Breakout? Analyzing the Rebound Potent...
KingKKK Technical Outlook - PPB (From Bottom to Breakout? Analyzing the Rebound Potent...
News & Blogs Blog: Technical Outlook - PPB (From Bottom to Breakout? Analyzing the Rebound Potential), #PPB, PPBGroup
Technical Outlook - PPB (From Bottom to Breakout? Analyzing the Rebound Potent...
News & Blogs Blog: WHOLE WORLD PALM OIL IN BULL RUN: WHEN WILL MALAYSIA RESEARCH HOUSES UPGRADE PALM OIL SHARES FROM NEUTRAL TO OVERWEIGHT? Calvin Tan
Harm to orang utans not the factor in Ghana, or Nigeria. So price can appreci...
News & Blogs Blog: Malaysia’s data centres poised to lead in AI Innovation amid growing global demand
for AI play, go for US stocks. Dont waste time on Malay stocks. Only the best ...
News & Blogs Blog: US may hit new debt limit as early as Jan 14, Yellen says
senang solve je, print more toilet paper US dollar
News & Blogs Blog: Russia's Medvedev accuses Norwegian-flagged vessel of refusing to help sinking ship
Norway= Nato can't help enemy
News & Blogs Blog: SUPERMAX VERSUS TOPGLOVE, KOSSAN & HARTA, Compare & Contrast, By Calvin Tan
Yes we started buying Supermax early from 86 sen to 92 sen
Then bought more ...
News & Blogs Blog: Why traders might be the cause of recent volatility
Nowadays, all is FAKE。
Can't distinguish FAKE & REAL。
Tan KW . 2024-12-29
Tan KW . 2024-12-29
Tan KW . 2024-12-29
Tan KW . 2024-12-29
North Korea launches 'toughest' US strategy in key party meeting
Tan KW . 2024-12-29
Plane drives off runway and crashes at airport in South Korea, Yonhap reports
Tan KW . 2024-12-29
Putin apologizes to Azerbaijan over 'tragic' plane crash | REUTERS
Tan KW . 2024-12-29
Mortgage rates may remain above 6% 'even until 2026,' expert says
2024-12-27
2024-12-26
Indices


Market Summary
Gainers
617
Losers
420
Unchanged
540
Untraded
845
Daily Stocks
Stock Name
Last
Change
Volume
Stock Name
Last
Change
Volume
Stock Name
Last
Change
Volume
MQ Trading Signals
Stock
Time
Signal
Duration
No trading signals available.
Stock
Time
Signal
Duration
No trading signals available.
Stock
Price Target
Price Call
Firm
Date
Stock
Type
Quarter
Stock
YoY Growth
Ann. Date
Stock
Dividend
Stock
Subject
Amount
Ann. Date
Stock
Type
Stock
Name
Type
Stock
Name
Type
Ann. Date
Stock
Units
Search i3investor
Featured Posts
Introducing MY's First IPO Fund for Sophisticated Investors!
New Update. Discover investment communities that resonate with your ideas
M & A Value Partners IPO Equity Fund has been launched - Targeted 13% Return p.a
Latest Videos


Apps


Top Articles
2
Mercury Securities Research
4
THE INVESTMENT APPROACH OF CALVIN TAN
UNDERSTANDING THE UPCOMING ELECTRICITY TARIFF BY TENAGA NATIONAL, Calvin Tan
5
THE INVESTMENT APPROACH OF CALVIN TAN
SUPERMAX VERSUS TOPGLOVE, KOSSAN & HARTA, Compare & Contrast, By Calvin Tan
6
Good Articles to Share
7
8
Good Articles to Share
WHO chief says narrowly escaped death in Israeli strikes on Yemen airport
#
Stock
Score
Featured Advertisers
AmEquities (LYH)
Cash upfront (brokerage 0.05% flat), T+2 / T+7 account (3x cash, 2x share), Margin account (competitive interest)
TA Securities (DJS)
Cash collateral (1x cash, 1x share), T+2 / T+7 account (3x cash, 2x share), Margin account (flexible margin)
M+ Online Kulai Branch
Cash upfront (brokerage 0.05% - 0.08%), T+2 / T+7 account (2x cash, 1x share)
Featured Advertisers / Partners


Asia Analytica's Top Picks for 2024
Moving into 2024, we think two specific industries could do well, namely the construction and digita...
The Star's Stock Pick 2024
The Star's Stock Pick 2024
MPLUS 1Q24 Market Chat: Reboot, Realign and Revitalise
The US GDP continues to grow, while inflationary pressure has been cooling off throughout the year. ...
TA Research Top Picks for 2024
TA research shared a few key investment themes for 2024, which are the digital economy, domestic spe...
Maybank Investment Bank's Top Mid-Small Cap Buys for 2024
2024 should be a better year for Malaysia on several fronts. It will be a year of execution of the m...

Ride The Bull Short The Bear
CS Tan
4.9 / 5.0
This book is the result of the author's many years of experience and observation throughout his 26 years in the stockbroking industry. It was written for general public to learn to invest based on facts and not on fantasies or hearsay....
Regional Stocks - SG
Stock Name
Last
Change
Volume