


Future Potential of HengYuan
Part 2 - Biggest Winner of Refinery Margin Rally

Free Cash Flow Analysis
As I mentioned before in my previous article on Petronm (part 3) (https://klse.i3investor.com/blogs/david_petronm/127594.jsp), free cash flow from operation is an important metric for me to measure the quality of a company’s earning. Let us go through Henguan’s free cash flow from operation as below:

Source: Q1’17 report
From the above table, one can notice that operation profit before changes in working capital is RM341mil. This is the actual free cash flow generated from operation before considering the inventory, receivables and payables.
It can be observed that HY reinvested free cash of RM262mil in Q1’17 to its inventory as compared to reduced its inventory level by RM82 mil in Q1’16 (bracket mean amount spent). It also spent RM38mil to reduce its payables and receivable is increased by an amount of RM35mil. As a result, its net cash flow from operation is only RM6.9mil (Q1’17) as compared to RM32mil (Q1’16).
Now we can observe that reducing inventory level can increase the cash flow from operation and increasing inventory level will has opposite effect. You may wonder why HY wants to invest heavily in its inventory instead of paying off its debt.
Let see another cash flow report from previous quarter (Q4’16) as below:

Source: Q4’16 report
From table above, there are free cash flow of RM660mil in Q4’16 from operation before changes in working capital while RM498mil of cash generated in Q4’15.
What I want to show to you from the above table is Shell (now HY) can produce cash from of RM783mil by reducing its inventory by an amount of RM181mil in Q4’15. Similarly, HY also generated RM117mil free cash even it has invested RM125mil in iinventory in Q4’16. Alternatively, please refer to the chart below for a general picture of cash flow for HY from 2014-2017 (Q1 only)
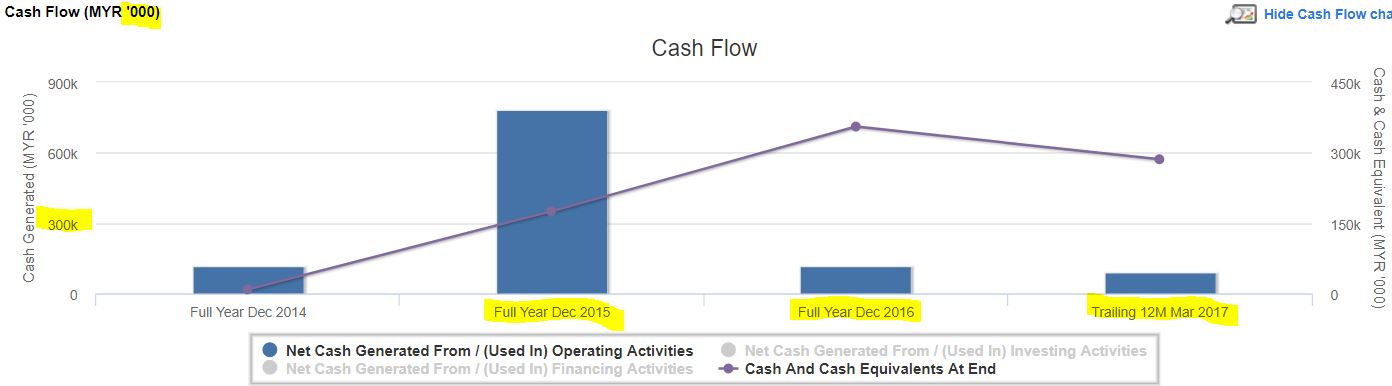
What are the conclusions we can draw from these two tables and the above chart?
1. Free cash flow can be increased by reducing its inventory (mean sell some stock for cash).
2. High quality of earning as it can generate good cash flow from operations (RM117 mil and RM783mil in Q4’15). One may question that RM6.9mil (Q1’17) is low cash flow but bear in mind that the low cash flow is due to HY reinvested RM262mil cash to its inventory. Imagine how much free cash HY able to keep in bank if it just invests a portion from the RM262mil cash to inventory (say RM80mil).
Next, I will discuss its possible motive of keeping high level of inventory.
Motive of High Level of Inventory
As mentioned by my previous article (https://klse.i3investor.com/blogs/davidtslim/128328.jsp), HY keeps inventory of RM1,075 mil (十亿七千五百万. Its inventory should consist of and crude oil and refined petroleum products (Eg. naphtha, gasoline, diesel, heating oil, kerosene). From my imagination or deduction, it may want to increase its daily throughput from 112k bpd (Q1’17) to a higher level in Q2’17. The motivation of this throughput increment is due to 5-year high refinery margin (crack spread).
Let us have an assumption of the larger crude oil stock due to higher value of inventory:
Previous HY’s article assumed 18 days stock for about 2.02mil barrels of crude oil (112.2k x 18). If HY wish to increase its throughput by 11% or 12.8kbpbd to 125kbpd, then it needs to keep around 2.25 mil barrels (18 days x 125k) of crude oil stock.
New Profit calculation if throughput is 125kbpd (kilo barrel per day)
New Stock loss = 2.25mil brl x (48.2 – 52.95)
= USD -10.69mil
= RM-45.96mil
New Refinery margin in a quarter (based on its Q1 estimated throughput per day of 125 kbpd)
= 11.25mil barrels X USD8.25 (estimated profit margin per barrel)
= USD 92.81mil
= RM 399.09mil
Let calculate the new Gross profit of Hengyuan’s Q2’17 as below:
Gross Profit = -45.96+ 399.09
= RM353.14mil (assume 125 kbpd)
From previous article (https://klse.i3investor.com/blogs/davidtslim/128328.jsp), gross profit calculated by assuming throughput of 112.2kbpd is = RM317.06mil
So the net increment in gross profit (GP) if throughput 125kbpd
= RM353.14mil - RM317.06mil = RM36.08mil
Let us compare the difference if Hengyuan management keeps the 80% of RM262mil cash to Fixed Deposit in bank (or reduce debt) instead of reinvested in inventory.
|
|
Keep in FD (3% interest) |
Reinvest in inventory |
Difference |
|
Gross Profit from RM262 mil cash |
RM6.28 mil per year from interests
Converted to 90 days interests = RM1.57mil |
GP = 353.14-317.06 = RM36.08mil
|
ROI in FD is 3%
ROI in reinvestment = 55% ROI = return on investment |
From the table above, I leave it to your own judgment whether management’s decision to reinvest RM262 mil cash to inventory is a wise or right decision or not.
Actually RM36.08 mil can increase gross profit of HY by 9.13% based on Q1’17 profit.
In short, my deduction of HY increased its inventory in Q2 is to increase its daily throughput to boost its earning as currently the refinery margin is near to 5-year high.
Return of Equity (ROE) data
ROE is a measure of company's profitability by revealing how much profit a company can generate with the money of shareholders have invested. Formula for ROE is as below:
ROE = Net Profit / Shareholder’s Equity
Let calculate ROE of HY based on its equity and net profit.
|
Year |
2016 (Q1-Q4) |
2017 (Q1’17, Q2-Q4’16) |
Growth |
|
Net profit |
335 mil |
513 mil |
53% |
|
Equity |
1010.4 mil |
1274.8 mil |
26% |
|
ROE |
33% |
40% |
21% |
A ROE of around 18% is considered good enough, 20% is excellent, and 25% and above is considered superior.
Why I said 25% is superior? It is because this ratio indicates the company is very efficient to generate profit using the shareholder’s money (4 years can earn back our entire invested fund).
ROE of Hengyuan is 40% based on trailing 12-month’s profit and equity. If this ratio can be maintained, one can estimate how long they can earn back shareholder’s fund.
I may discuss other indicators like EV, EV/EBIT and ROIC if deem necessary in my part 3 article of HY.
Prospect
HY’s profit is closely related to refinery margin (crack spread). Why “crack” term is used in refinery industry? It is because refiners buy crude oils and crack them into petroleum products. The differential between the finished products (e.g. gasoline, diesel, jet fuel etc) and the crude oil is called crack spread.
Let see the latest Singapore crack spread chart up to end of July to estimate HY’s visibility of its profit in Q3’17 (July-Sept 17) as below:
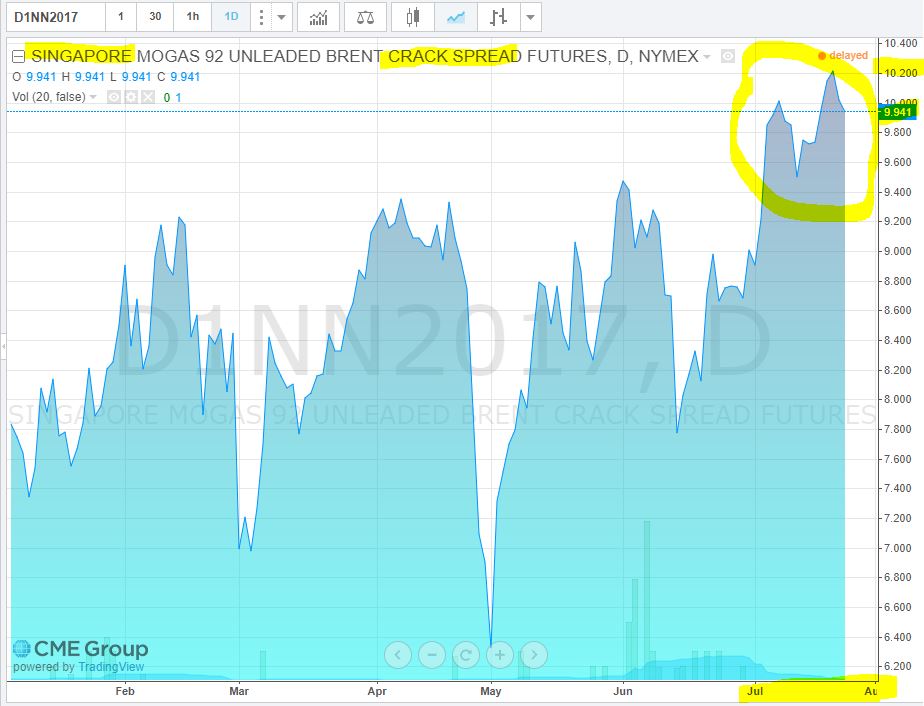
Anyway, this is just up to end July. I may prepare another article for refinery margin estimation if got time in future.
Let us have an overview of all the Malaysia oil refinery players.
1) Hengyuan Port Dickson Refinery, 156 kbpd (24,800 m3/d)
2) Petronas Melaka I Refinery, 100 kbpd (16,000 m3/d) – Not listed
3) Petronas Melaka II Refinery, 170 kbpd (27,000 m3/d) – Not listed
4 ) Petronas Kertih Refinery, 40 kbpd (6,400 m3/d) – Not listed
5) Petronm Port Dickson Refinery, 88 kbpd (14,000 m3/d)
6) TIPCO Kemaman Bitumen Refinery, 30 kbpd (4,800 m3/d) – Not listed
Theoretically Malaysia has maximum daily capacity/throughput of 584 kbpd. Anyway, I guess most of the players did not run at maximum daily capacity. I estimate most of average daily capacity for these players is around 85% (except Petronm) which lead to around 500 kbpd. Of course, I am aware of RAPID project but that is the story of 2019.
Our neighbour, Singapore has 3 refinery plants (owned by Exxon, Shell and Singapore refinery) which collectively have a daily maximum capacity of 1380 kbpd. Based on our country demand data, I believe Malaysia still imports refined products from Singapore as our supply is still less than demand.
As some of you may aware, Alibaba (Taobao)’s regional (SEA) distribution hub will be based in KLIA (http://www.reuters.com/article/us-alphabet-results-research-idUSKBN1AA1ON), Malaysia. From this development, I expect future land and air travelling will be increasing that will lead to higher diesel and Jet fuel consumption.
In short, I think the demands in medium term in Malaysia should still have room to grow. In addition, the supply in Asia is also limited due to some scheduled and unexpected maintenance in Asia’s refinery players. Please refer to some supporting news for the above-mentioned maintenance as below:
1. http://jakartaglobe.id/international/asia-gasoline-outshines-jet-fuel-diesel-supply-shrinks/
It is worth noting that refinery operation margin depends on crude oil cost, transportation, factory efficiency, throughput or volume, distribution network, refinery location and simple or complex refined system (HY is a complex refiner).
Let see a latest news on Royal Shell's result boosted by refinery as below:
Summary
1. What I can see from refinery business is a business which has a consistent and slow growing rate (due to Malaysia vehicle population is growing) and its profit is closely related to crack spread (refinery margin).
2. Stock loss (due to falling of price of crude oil) can be easily offset by refinery profit (as shown in my earlier calculation) with positive surplus based on current refinery margin.
3. Again, I would like to stress that refinery is a highly recursive business and super low labour-dependent as compared to other non-continuous business revenue (Eg. construction sector depends on contract), where the management skills, competency, weather, material costs, labour supply where all of them play an integrated role which is sometime unpredictable.
4. HY’s Q2 high level of inventory may lead to a possibility of its daily refinery throughput increment which should further drive its Q2 profit to a higher level.
5. To reap profit from stock market, one good practice is buy a good company at CHEAP price and SELL it when it is already fully valued. For me, LOW in PRICE ≠ CHEAP, HIGH in PRICE ≠ EXPENSIVE. It is all depends on future earnings visibility per share and cash flow from operation. (Reason for high in price is due to profit keeping increasing but total no of shares remain intact)
For those interested on technical analysis on Hengyuan, please refer to the chart below where I can notice a breakout and uptrend momentum signal. DE (Deviation Expert) signal shows a positive inflow fund with two Red bars on 25 and 26 July (mean fund inflows > outflows). The Red bar on 26 July is longer than previous day also indicates stronger inflow fund which correlates well with price action.

Stay tune for my Hengyuan’s Part 3 article for its possible foreign exchange gain or loss, further cash flow and debt analysis, valuation analysis etc.
If you interested on my analysis report, please contact me at davidlimtsi3@gmail.com
You can get my latest update on share analysis at Telegram Channel ==> https://t.me/davidshare
Disclaimer:
This writing is my own imagination for all the assumptions and estimations. It is strictly for sharing purpose, not a buy or sell call of the company.
Related Stocks
| Chart | Stock Name | Last | Change | Volume |
|---|
Market Buzz
More articles on Future Potential of HengYuan
HENGYUAN Part 8: Valuation, Q4 profit and Q12018 Spread (Davidtslim)
Created by davidtslim | Jan 19, 2018
Discussions
10 people like this. Showing 24 of 24 comments
David..i admire you for the amount of hardwork you had placed for compiling all these hard to obtain information and present it in a relatively easy format for people to go through and understand.
Nice to see the information in all your posting has the 'required flow' / continuity to it. My sincere appreciation.
2017-07-27 18:31
probability....can summarise what david wrote? hehe....I must be hardowking d
2017-07-27 18:32
Thank you for the extensive research. Just a minor error, rapid is scheduled to commence operation in q1 2019, not 2020
2017-07-27 18:34
Alex..with you i have to start with Q&A...as usual..
so u must shoot your question first! he he
2017-07-27 18:36
Thanks probability and soojinhou for your comments. I corrected Rapid to 2019 but normally with some technical challenge and big investment required, it has the possibility to delay.
2017-07-27 18:49
I have one question, not sure if it is a stupid one.
How come the crack spread recover? What has lead to it? Is it sustainable?
2017-07-27 18:52
Anyone? Probability. You are expert. I forgot what is the reason spread improve
2017-07-27 19:34
paper , so many articles posted on these to explain it..but the core factor is the 'constraint for refining within the region'....
for HRC, one needs not worry if the current good crack spread is sustainable..but only just value it with a reasonable long term high complexity refinery margins.
as can be shown, even 6 USD/brl should easily value it at RM 16 with a PE less than 10.
the current good refinery margin exceeding 9 USD/brl should be taken as a blessing to par down their Debts in the short term and even sustain a better net profit in the future with the finance costs completely eliminated.
The already low crude price had also eliminated risks of significant stock loss in the future ensures that HRC is rightly placed to kill the Debts.
2017-07-27 19:41
Thanks probability. I hope they do slowly parred down debts. As interest seems going to be higher and higher for future
2017-07-27 19:41
I increased the size of the cash flow chart for a more comfortable view. Previous chart font size is too small.
U can check again the article as I hv done some corrections
2017-07-27 20:22
Thanks David for the hard works and efforts. Also many thanks on your selfishnless sharing here. I learnt a lot from reading all hardwoods here. Yours surely a must read!
2017-07-27 21:57
David, sure appreciate yr hard work to enlighten us on the prospects of HY. Thanks
2017-07-27 21:59
A few things come to my mind as well.
1. Auto sales! If more cars on the road, it will lead to more demand, so more volume of business. So it might help to have some studies or forecast on future of autocar business in Malaysia? Will hybrid car be a threat , electronic car etc?
2.ROE is used here. It has also substantial debts. Is ROA more relevant? Assets is equity plus liability.
3. ROE my view could be misleading. Equity is not the price we paid now. We paid now market price RM6.36xoutstanding shares 300mil. If I were to takeover this Hengyuan now, I am buying it at open market this prices of RM1.91bil. isn't this more relevant, compared to equity of RM1.27bil above.
2017-07-27 22:03
Using same logic, I guess. PetronM shall at the same time do well! So buy petronm and hengyuan as both still so undervalued!
2017-07-27 22:03
remember, by 2040, no gas or diesel vehicles in UK!! any impact on oil price?
2017-07-27 22:06
3. ROE my view could be misleading. Equity is not the price we paid now. We paid now market price RM6.36xoutstanding shares 300mil. If I were to takeover this Hengyuan now, I am buying it at open market this prices of RM1.91bil. isn't this more relevant, compared to equity of RM1.27bil above.
aiya paper..thats why P/E is invented!
2017-07-27 22:22
Yes. Debts might not be a major concern now unless interest keep rising too fast. But still it is manageable after considering inventory, which can easily convert into cash.
But in term of return should we use ROA?ROE?
2017-07-27 22:51
(P/B) / (ROE) = P/E
whenever your ROE the Denominator goes high...
your Numerator (P/B) i.e Mcap over Equity has to go proportional higher..
to maintain the same P/E.
P/E is the King.
Of course ...the above is only true provided you use the right normalize representative Earnings - E in the above equation.
2017-07-27 22:55
I always use ROA to ensure its definitely way way above Cost of Debt (COD, the interest rate). Their difference is basically 'the sea depth' for the Ship to stay afloat.
This way we know we dont get cheated by high ROE due to high Debt while the ROA is just barely above the COD.
If the ROA too near to COD and sinks just a little lower the ship may just hit the seabed..and stall.
2017-07-27 23:03
Post a Comment
Featured Posts
Introducing MY's First IPO Fund for Sophisticated Investors!
New Update. Discover investment communities that resonate with your ideas
M & A Value Partners IPO Equity Fund has been launched - Targeted 13% Return p.a
Latest Videos

.png)


MQ Trading Signals
Time
Signal
Duration
Type
2024-10-02 16:40:00
EMA 5
5 Mins
BUY
2024-10-02 16:40:00
TURTLE SYSTEM 20
5 Mins
BUY
2024-10-02 16:30:00
EMA 5
5 Mins
SELL
2024-10-02 15:30:00
ADX
30 Mins
BUY
2024-10-02 14:40:00
EMA 5
5 Mins
BUY
Apps


Top Articles
1
Mercury Securities Research
3
4
6
7
8
TA Sector Research
#
Stock
Score
Daily Stocks
Stock Name
Last
Change
Volume
Stock Name
Last
Change
Volume
Stock Name
Last
Change
Volume
Featured Advertisers / Partners


Ride The Bull Short The Bear
CS Tan
4.9 / 5.0
This book is the result of the author's many years of experience and observation throughout his 26 years in the stockbroking industry. It was written for general public to learn to invest based on facts and not on fantasies or hearsay....
probability
http://in.reuters.com/article/asia-refinery-idINL4N1JY2A3
2017-07-27 18:23